
The Recursion Map, Concentration Is the Input, Not the Risk
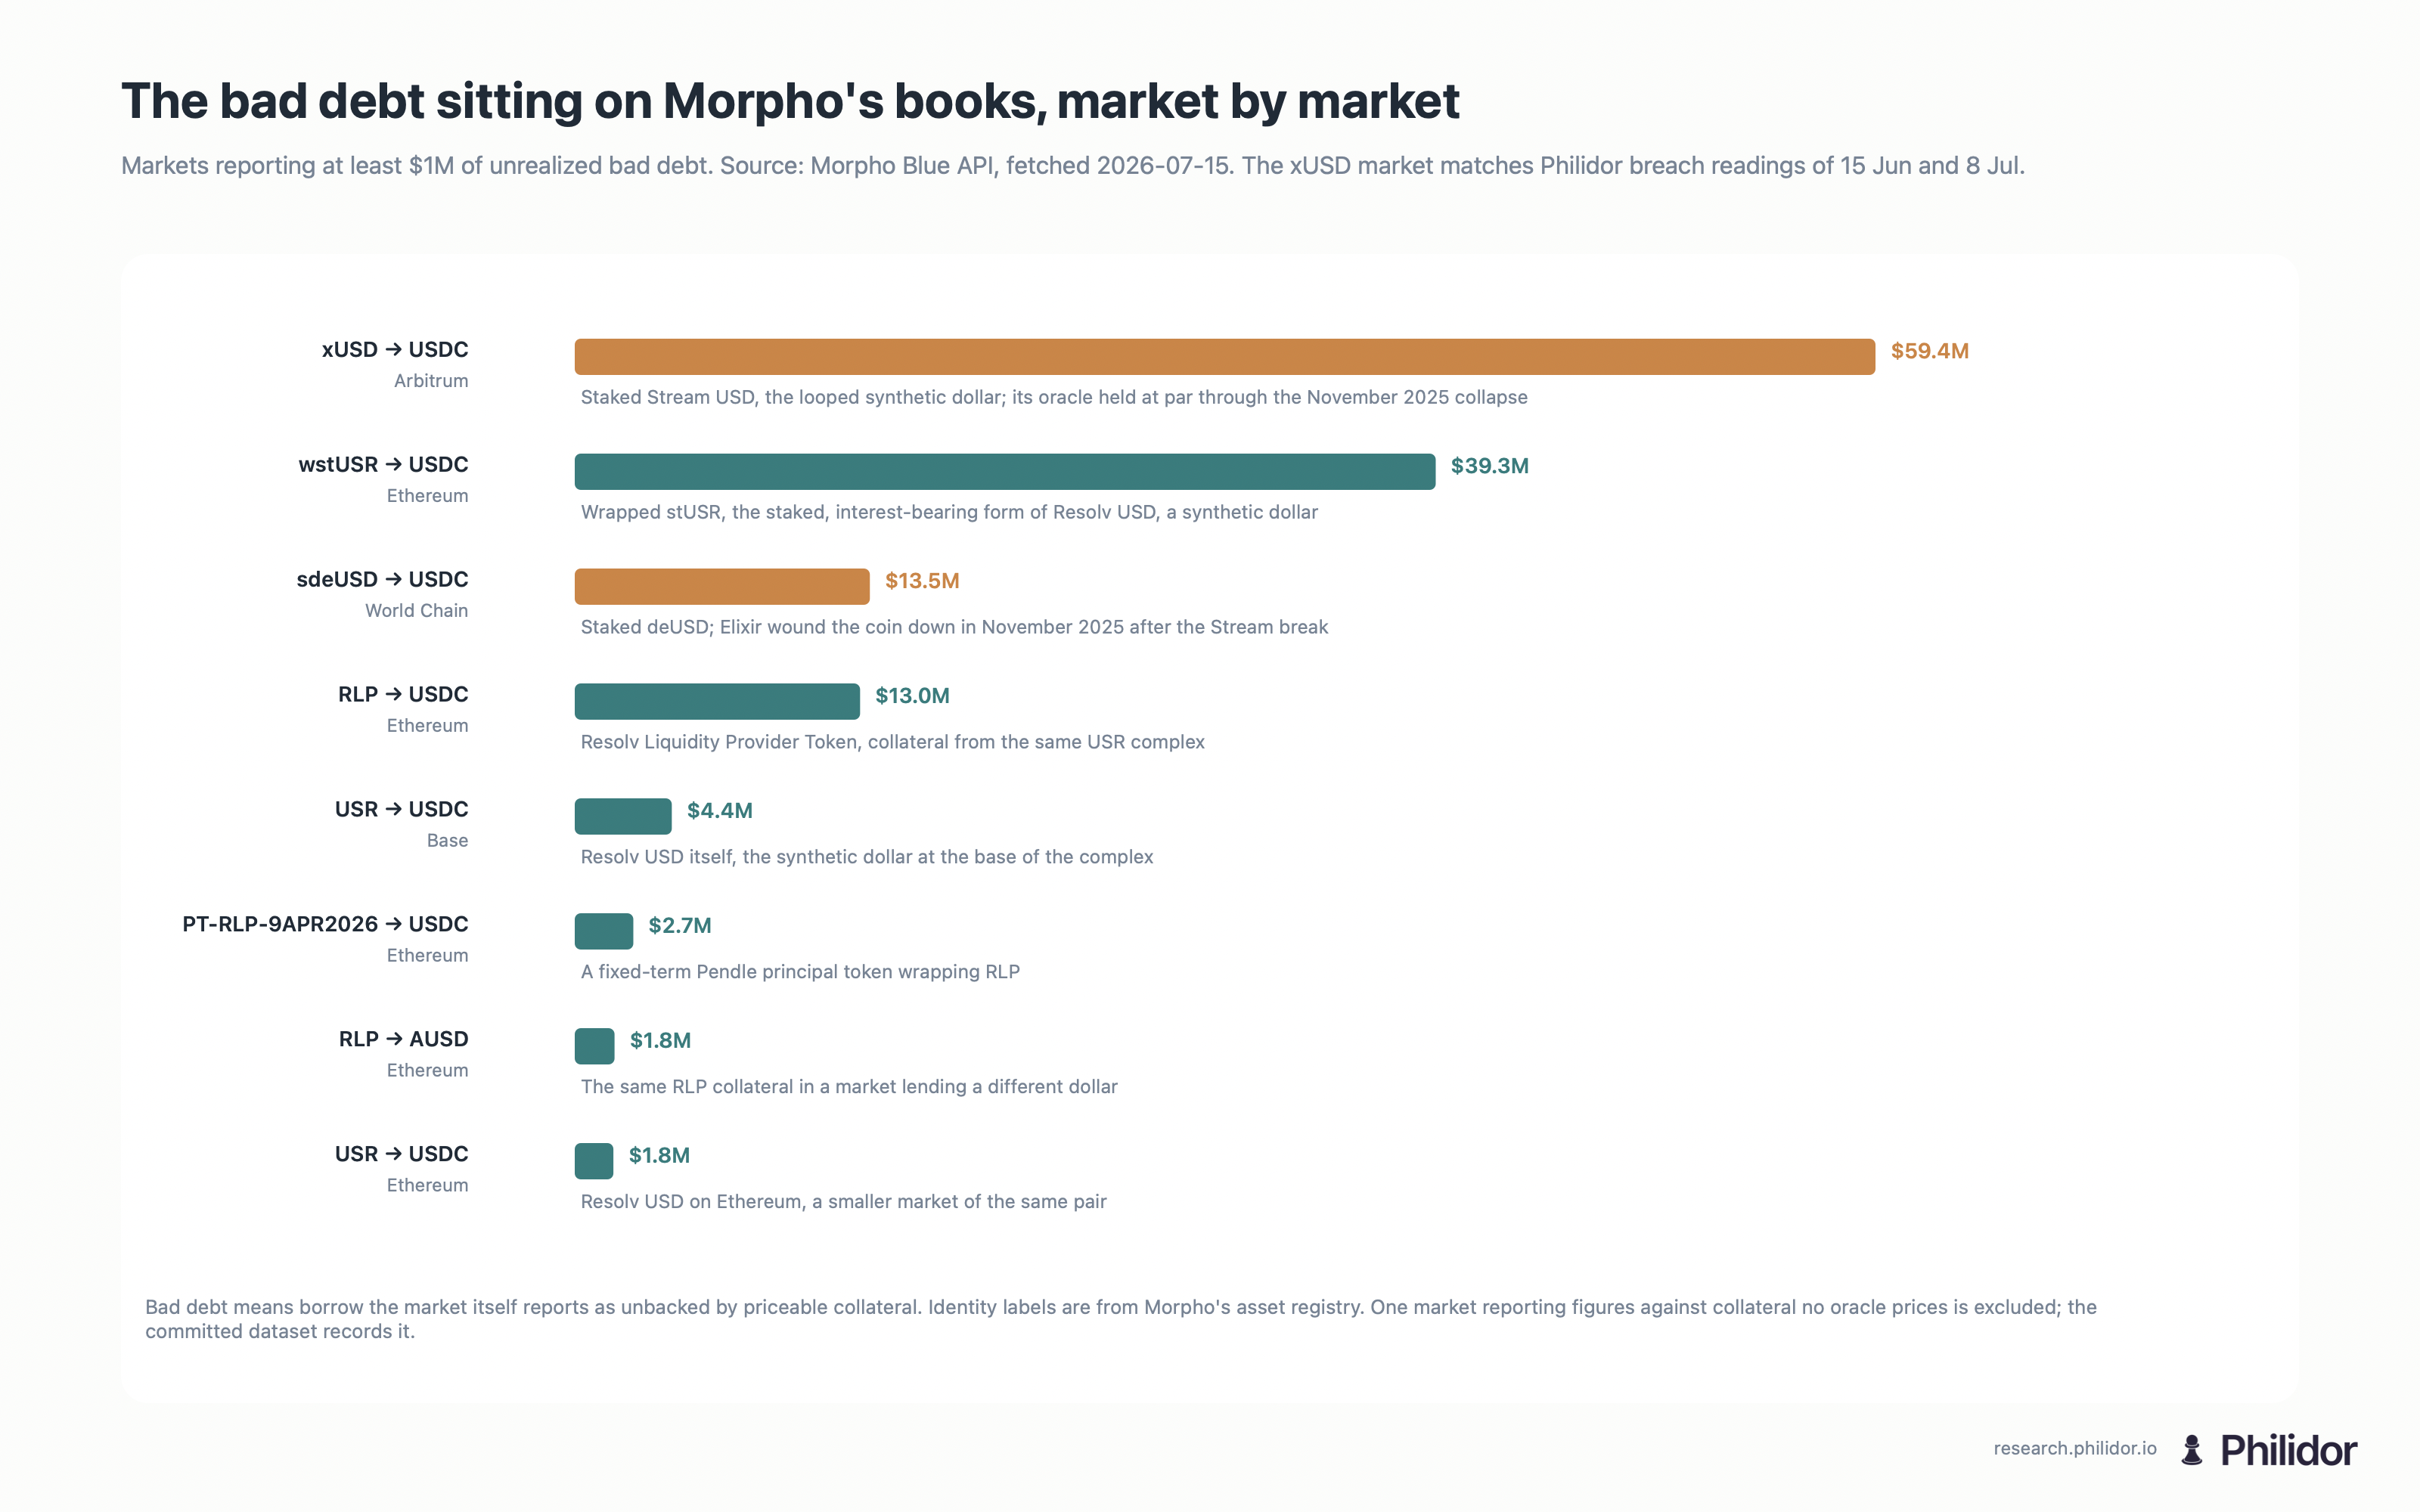
Morpho's own books carry $59.4M of bad debt in a single Arbitrum market. Bad debt is borrowed money the posted collateral can no longer cover. Borrowers there took USDC against xUSD, the synthetic dollar that collapsed with Stream Finance in November 2025 (Morpho Blue API, read 15 July 2026). Our breach scan, the sweep that checks every open loan against its market's own liquidation rules, read the borrow at $41.4M on 15 June and about $55.6M on 8 July. Morpho's books put it at $60.5M on 15 July. The collateral behind it was worth about $46,000 to $49,000 at observed prices the whole time. That is three positions, a liquidation loan-to-value line of 0.915, and a health factor of about 0.001, month after month. A health factor that low means the loan should already have been liquidated. It never is, because the market's own oracle never marked xUSD down. Maybe the climb is purely interest accruing on debt nobody can repay. Maybe part of it is our scan and Morpho's accounting measuring on different bases. Either way, that changes the bookkeeping, not the outcome. Nothing about this position can clear.
Concentration is visible on every position. Roughly $42B of on-chain credit sits in USDC, on Ethereum, under a handful of curators. That makes it the input to the risk question, not the risk itself. The risk is underneath. It is what the collateral resolves to once you trace its dependencies, and whether debt the model calls liquidatable actually clears. Every figure below shows exactly where its numbers came from and how to re-run them.
The failure this paper studies is measurable on public books today. Morpho's own API reports the bad debt sitting on each of its markets, and the board below is what it returned on 15 July.1 The two November residues sit at the top; the xUSD line reads higher than our frozen June and early-July breach observations, a gap consistent with interest accruing between the reading dates. One market is left off the board and recorded in the committed dataset instead. No oracle prices its collateral, so we cannot check what it claims. Our scan engine routes rows like that into an unknown band, defined further down, rather than certifying them.
Concentration, in four numbers
Those are shares of the EVM lending and yield that Philidor scores rather than of all DeFi. The honest denominator is wider. DeFiLlama puts total value locked across DeFi at $73B across 453 chains, with Ethereum at 53% (snapshot 2026-06-23, and we don't index Solana, BSC, Tron, or Bitcoin). Ethereum dominates on-chain credit either way, and our universe is a denser slice of it. The share is not the point. What matters sits underneath, meaning what the collateral resolves to a hop or two down. It also means what happens when the model says a position should close and it doesn't.
The literature already asked this question
"Everyone can see it's concentrated, so what" has a thirty-year-old answer. Allen and Gale showed in 2000 that whether a shock spreads depends on the shape of the claims between institutions, not on the headline size of any one exposure.2 Acemoglu, Ozdaglar and Tahbaz-Salehi sharpened that in 2015 into the result this paper's title restates. Concentration is the input to the risk question, not the risk.3 Dense financial networks are robust yet fragile. They absorb small shocks and propagate large ones, so the same topology can be the safest configuration in the room and the most dangerous one, depending on what hits it. That is the formal version of concentration being the input to the risk question rather than the answer.
The second measurement, whether flagged debt actually clears, has its own ancestor. Eisenberg and Noe formalized in 2001 how the debts of interlinked firms settle all at once, and proved a clearing outcome exists and is essentially unique.4 Asking whether a liquidation the model expects would actually go through is the on-chain descendant of that computation.
The chains themselves have been measured before, barely. Singh spent years estimating how many times the same collateral is re-pledged through dealer banks, a number he called collateral velocity, about 3 at the end of 20075 and about 2.2 by the end of 20126 after Lehman taught the market what re-pledged collateral means in a failure. The method was hand-collecting footnotes from dealer filings, because the chains were off balance sheet and invisible. That gap is where this paper works. On-chain, every pledge and re-pledge is public state, so the chain is enumerable rather than estimable. The 23% share below is a cousin of Singh's measurement rather than its equal. He inferred re-pledges of the same collateral. We count layers of claims directly, and counting layers is the weaker claim.
Reading the dependency graph
The look-through graph resolves a vault's collateral to the assets that actually back it. It follows each wrapped or backed token down, layer by layer, to the final assets underneath, the leaves of the graph, and records the price oracle for each leaf. Every resolution is stored under a fixed snapshotId derived from the data itself, so if the underlying numbers ever change the id changes too, and the old snapshot still reproduces exactly. The figures below are snapshot 7e467750…, built 2026-06-15 18:14 UTC over a 48-vault sample (keys and formula in the appendix).
The resolution does real work. A single Aave vault resolves not to one asset but to its whole collateral set, and within that set the graph follows backing edges wherever the data supports it:
| Field | Value |
|---|---|
| Vault | 1:0xec4ef66d… |
| Resolved leaves | WBTC, USDe, wstETH, sUSDe, USDC, WETH, USDtb, cbBTC, weETH, USDT, osETH |
| Backing traced deeper | USDtb → BUIDL |
| Closed cycles, collateral looping back to this vault | 0 |
/v1/graph/look-through · snapshot 7e467750… · as of 2026-06-15The resolution is real where the data supports it. USDtb is followed down to BUIDL, the tokenized fund behind it. It is incomplete where the data doesn't reach, so wstETH, weETH, sUSDe, USDe, and osETH show up as endpoints, even though each is a claim on something else. That makes the resolved view a lower bound on recursion.
Even as a lower bound it is large. Across the 48 vaults, some collateral is itself wrapped, staked, restaked, meaning staked again to secure another network, or synthetic. That is a layered claim rather than a final asset. It comes to about 23% of resolved exposure ($8.0B of $34.8B, with keys, classification, and formula in the appendix). The 48 vaults are an Ethereum-mainnet sample, not a random draw, and a few large vaults dominate the weights, so read the share as a property of this sample. No cycles appear, meaning nothing resolves back to a vault already in its path, so the layering here is depth, not loops.
Tradfi's nearest name for what these wrappers are doing is rehypothecation, the same economic collateral pledged again one layer up. The analogy is close but not exact. Wrapping or staking does not by itself re-pledge anything, so what the 23% measures is layered-claim exposure, the precondition for on-chain rehypothecation rather than proof of it. The behavioral footprint is measurable elsewhere too. The BIS finds wallet-level leverage on Ethereum lending protocols typically runs 1.4 to 1.9, with the largest and most active borrowers the most levered,7 which is the behavioral face of the same structure.
The pieces of this graph each have their own literature. Durvasula and Roughgarden derive the conditions under which restaking cascades stay bounded,8 and Gauntlet's desk work on recursive borrowers, users who borrow and supply the same token simultaneously, tracks how loopers behave when rates move.9 What none of that work does is resolve a specific vault's collateral to its leaves and stamp the result to a reproducible snapshot, which is the job here.
Recursion as a live signal
The dependency argument has a real-time face. The incident feed logs wrapped and principal tokens depegging alongside the assets they are built on, one exposure at each layer. Here is a frozen reading, stamped 2026-06-15 18:12:26 UTC. apxUSD sat at $0.9571 (−4.3%, event 7573821). In the same reading, PT-apxUSD-18JUN2026 sat at $0.9562 (−4.4%, event 7573822). That token is a Pendle principal token, a claim that resolves to apxUSD. They move together by construction. The live feed below is the current state of the same pattern, not evidence for the frozen line.
We have run this experiment before
Recursion unwinds are not a DeFi novelty. Geanakoplos put the through-line in one sentence in The Leverage Cycle. Equilibrium determines leverage, not just interest rates, and swings in collateral terms drive the booms and the crashes.10 The table is that cycle, run five times in seventeen years.
| When | The loop | What broke | What a look-through would have shown |
|---|---|---|---|
| Lehman, 2008 | Client collateral re-pledged through prime brokers11 | LBIE froze; clients found their assets were no longer theirs, and dealer banks suffered a new kind of run12 | The length of the pledge chain, which was only estimated after the fact, as velocity falling from 3 toward 2.2 |
| GBTC, 2021 | Borrow BTC, buy GBTC at a 10 to 50% premium,13 pledge the shares, repeat | The premium flipped to a discount in February 2021 and never came back; 3AC and BlockFi were the two largest holders14 | One trade wearing many balance sheets |
| stETH, June 2022 | Stake, pledge stETH, borrow ETH, restake and loop15 | 3AC pulled $400M from the Curve pool on May 12 and Celsius $380M the same day; Celsius froze withdrawals16 on June 12 as the discount hit a record 8%17 | The same ETH underneath every layer of the loop |
| FTX, Nov 2022 | Client assets commingled and re-used off-chain18 | Everything | Nothing. The books were off-chain, which is the honest limit of this method |
| Stream, Nov 2025 | xUSD looped at roughly 4× | The centerpiece of this paper, below | The graph flags the residue daily |
Four of the five ran where a dependency graph could have watched them, and the market got bigger between every run. Total DeFi TVL first crossed $1B in February 2020, peaked near $177B in November 2021, and fell under $39B by the end of 2022 before rebuilding.19
A market the model flags but never clears
That recursion has a graveyard. The single largest liquidation failure on the breach surface, the live dashboard where our scan publishes every flagged market, is the on-chain residue of the Stream Finance collapse. xUSD was a synthetic dollar that Stream ran on roughly 4× recursive leverage, meaning the same capital borrowed and redeposited layer after layer. It fell from $1 to $0.26 in early November 2025. That came days after a $128M Balancer exploit put the whole Stream complex under stress, and days after Stream disclosed a loss at an external fund manager.20 The collapse was not unforeseen; rekt.news had published a warning dissecting the loop three days before it broke.21 The lending oracles had hardcoded xUSD at $1.27, so the positions never showed as unhealthy and liquidations never fired. About $285M of bad debt was left across Morpho, Euler, Silo, Gearbox, and Elixir, and $160M of user deposits was frozen with no path to recovery as of the November accounting.22 One Arbitrum market carries the piece of that residue our 15 June scan flagged. Here is what the model returned.
| Field | Value | Source |
|---|---|---|
| Market | 42161-0x9e90…7709 | breach.topMarkets |
| Collateral → loan | xUSD (Staked Stream USD) → USDC | on-chain |
| Borrow | $41,428,197 | observed |
| Collateral value | $49,172 on 15 Jun, about $46k on 8 Jul, reported and near-worthless against the debt at both readings | observed |
| Positions / liquidation LTV (LLTV) | 3 / 0.915 | observed |
| Liquidatable debt, low and high bound, at 5/10/25% collateral shocks | [full, full], the whole borrow, certain | breach kernel |
| Health factor | ≈ 0.001 = (49,172 × 0.915) / 41,428,197 | derived |
| Liquidation incentive (LIF) | ≈ 2.6% = 1/(0.3 × 0.915 + 0.7) | derived, Morpho LIF |
The reason it never clears is mechanical rather than behavioral. A liquidator could seize the collateral and repay debt worth about as much, earning the roughly 2.6% incentive this liquidation loan-to-value setting gives. But the collateral is xUSD, and no honest oracle prices it above zero, so there is almost nothing to seize. The other ~$41.4M has no real backing at all. So this is not a missed liquidation but uncollateralized bad debt. The posted collateral cannot cover it at observed prices, and liquidation cannot change that. Someone has to write the debt down or inject outside assets, the remediation Morpho's own documentation describes.23
The breach surface now resolves this directly. It shows each market's collateral and loan token, its oracle, the worst health factor, and a deterministic why-not-liquidated label. For this market the classifier returns collateral-exhausted: the debt is certified underwater and the remaining collateral covers less than five percent of it, so a liquidator has nothing worth seizing. That label and the [full, full] bound are two sides of one fact. The scan engine can price this collateral, near zero, so it certifies the debt liquidatable in principle at any shock. The label records why liquidating it achieves nothing. A different label, unpriceable-collateral, marks the opposite case, debt the kernel cannot certify at all because the collateral has no recorded price; that debt routes to the unknown band that lifts only the upper bound, and the $762.8M market described below is that case.
How the bounds are built, and why the range is wide
The breach kernel is public and small. For a relative collateral shock s, a position becomes liquidatable when its health factor24 drops below 1/(1 − s), the point where liquidation is permitted.25 Debt is sorted into health-factor bands, which gives a range rather than a single number.
- lo = debt in bands entirely below the threshold (certain to liquidate),
- hi = lo + the band straddling the threshold + debt against unpriceable collateral.
That last term does the heavy lifting. When a position's collateral can't be priced, its health factor isn't evidence, so the kernel sends that debt to an unknown band that can lift only the upper bound, never the certain lower one. The rule exists because of a live case. One market reported a health factor of 0.05 on $3.7B of debt while its collateral had no recorded value at all, and the kernel refused to treat that health factor as real.
That rule produces the surface's most striking row. A market reports $762.8M borrowed against $0.10 of collateral, bounded at [$0, $762.8M] at every shock. Zero is certain, because the model won't certify unpriceable debt, and $762.8M is the worst case. On the live surface below, most of the lo-to-hi gap is exactly this. The model is declining to price what it can't, not making a forecast.
The surface is live, so it won't match the frozen numbers above. Read the lo-to-hi spread as how much of the book the model can't yet price, not as a confidence interval on a loss.
What would make this wrong
Each of these would prove it wrong.
- The stranded market may already be partly resolved. If the $49K is residual after a partial liquidation, or the debt has been socialized, on-chain history would show it.
- The 23% derivative share is sample-specific. It is 48 vaults in one snapshot, weighted by a few large ones, and a full-universe pass could move it either way.
- Resolved exposure is a lower bound. The graph leaves staking and synthetic wrappers unresolved, so it understates recursion. We know the direction of the bias, not its size.
- Breach coverage is partial. It covers Morpho borrower books only, and HF bands lose precision inside each band.
- The robust-yet-fragile reading is testable. The network theory this paper leans on predicts a phase transition. Dense networks absorb small shocks and propagate large ones. If the breach bounds do not steepen non-linearly with shock size on a full-universe pass, that reading of this market is wrong.
Each is a measurement we intend to run, which is why we publish the snapshot ids, keys, and formulas.
What an allocator does with this
Four moves, each one paid for by a failure documented above.
- Ask for look-through, not asset lists. Brand-level diversification is void when the leaves converge. Forty-eight vaults resolving to 23% derivative collateral is the measured case, and DAI inheriting USDC's depeg is the precedent.
- Treat the oracle as the liquidation guarantee. A hardcoded oracle converts overcollateralized lending into unsecured credit. xUSD at $1.27 forever is the proof sitting on this surface. Before sizing a position, ask what prices the collateral and what happens when it stops.
- Read a wide lo-to-hi band as unpriced rather than safe. The unknown band is the model refusing to certify. That slice deserves its own limit, the way an unrated bond does.
- Watch the trend of the derivative share, not its level. The class barely existed in 2020. Liquid staking launched that December,26 the largest synthetic dollar arrived in early 2024,27 and restaking peaked above $20B the same year.28 At least 23% of resolved exposure in this sample already sits in the class, and the phase-transition result says the danger of a dense network scales with shock size.
Provenance
| Metric | Endpoint | Stamp | Maturity |
|---|---|---|---|
| Universe concentration (our coverage) | /v1/stats, /v1/chains, /v1/protocols, /v1/curators, /v1/assets | observed 2026-06-15 | production |
| All-DeFi concentration (53% Ethereum) | DeFiLlama /v2/chains | snapshot 2026-06-23 | external snapshot |
| Stream Finance / xUSD collateral identity | Morpho market 42161-0x9e90…7709 → on-chain symbol() | resolved 2026-06-23 | on-chain |
| Resolved leaves, ancestry, cycles, 23% share | /v1/graph/look-through | snapshot 7e467750…, built 18:14 UTC | preview |
| Liquidatable [lo, hi]; underwater; the two markets | /v1/graph/breach | observed 17:38 UTC, params 08:48 UTC | preview |
| Frozen depeg co-movement | /v1/events (ids 7573821, 7573822) | recorded 18:12:26 UTC | live feed, frozen citation |
| HF, LIF | derived | Morpho documented formulas | derivation |
Breach bounds are liquidatable-debt ranges rather than loss estimates. Curator figures cover the Morpho segment only. Every figure is a snapshot of a moving system, and the ids above are how to reproduce or refute it.
Appendix, reproducing the 23% derivative share
7e467750b933b456f561eac136f8995c3199f1ed0da98691c44cc0db5c6b2528, Look-through, 48-vault chain-1 sample (built 2026-06-15 18:14 UTC)
- Derivative share:
Σ usdExposure[leaf ∈ derivative set] / Σ usdExposure[all resolved leaves] = 8,016,661,175 / 34,844,924,956 = 23.0%
The look-through endpoint always serves the latest snapshot, so re-running returns whatever the current snapshot says. The method reproduces, and the exact figure is as of the snapshot below. As observed:
- Snapshot.
7e467750b933b456f561eac136f8995c3199f1ed0da98691c44cc0db5c6b2528, built 2026-06-15 18:14:23 UTC. - Query.
GET /v1/graph/look-through?vaults=<the 48 keys below>(chain-1 vaults). - Derivative classification set. Symbols counted as wrapped / staked / restaked / synthetic, plus any leaf whose symbol begins with
PT-). Present in this sample:USDe, USDtb, osETH, rsETH, sUSDe, weETH, wstETH. - Formula.
share = Σ usdExposure[leaf ∈ derivative set] / Σ usdExposure[all resolved leaves]. - As observed.
8,016,661,175 / 34,844,924,956 = 23.0%.
1:0xa3931d71877c0e7a3148cb7eb4463524fec27fbd, 1:0x4d5f47fa6a74757f35c14fd3a6ef8e3c9bc514e8,
1:0x23878914efe38d27c4d67ab83ed1b93a74d4086a, 1:0x12b54025c112aa61face2cdb7118740875a566e9,
1:0x5ee5bf7ae06d1be5997a1a72006fe6c607ec6de8, 1:0xbdfa7b7893081b35fb54027489e2bc7a38275129,
1:0x98c23e9d8f34fefb1b7bd6a91b7ff122f4e16f5c, 1:0x0b925ed163218f6662a35e0f0371ac234f9e9371,
1:0xe2e7a17dff93280dec073c995595155283e3c372, 1:0x5c647ce0ae10658ec44fa4e11a51c96e94efd1dd,
1:0x2d62109243b87c4ba3ee7ba1d91b0dd0a074d7b1, 1:0x59cd1c87501baa753d0b5b5ab5d8416a45cd71db,
1:0xe7df13b8e3d6740fe17cbe928c7334243d86c92f, 1:0xc02ab1a5eaa8d1b114ef786d9bde108cd4364359,
1:0x4f5923fc5fd4a93352581b38b7cd26943012decf, 1:0x88e6a0c2ddd26feeb64f039a2c41296fcb3f5640,
1:0x28b3a8fb53b741a8fd78c0fb9a6b2393d896a43d, 1:0xc3d688b66703497daa19211eedff47f25384cdc3,
1:0x19b3cd7032b8c062e8d44eacad661a0970dd8c55, 1:0xb576765fb15505433af24fee2c0325895c559fb2,
1:0x4579a27af00a62c0eb156349f31b345c08386419, 1:0x4dedf26112b3ec8ec46e7e31ea5e123490b05b8b,
1:0xbc65ad17c5c0a2a4d159fa5a503f4992c7b545fe, 1:0x8ad599c3a0ff1de082011efddc58f1908eb6e6d8,
1:0x83f20f44975d03b1b09e64809b757c47f942beea, 1:0x4e68ccd3e89f51c3074ca5072bbac773960dfa36,
1:0xa9d4ecebd48c282a70cfd3c469d6c8f178a5738e, 1:0x6dc58a0fdfc8d694e571dc59b9a52eeea780e6bf,
1:0x927709711794f3de5ddbf1d176bee2d55ba13c21, 1:0xe3190143eb552456f88464662f0c0c4ac67a77eb,
1:0x3afdc9bca9213a35503b077a6072f3d0d5ab0840, 1:0xcbcdf9626bc03e24f779434178a73a0b4bad62ed,
1:0x4197ba364ae6698015ae5c1468f54087602715b2, 1:0x65906988adee75306021c417a1a3458040239602,
1:0x00907f9921424583e7ffbfedf84f92b7b2be4977, 1:0x99ac8ca7087fa4a2a1fb6357269965a2014abc35,
1:0xfe6eb3b609a7c8352a241f7f3a21cea4e9209b8f, 1:0x10ac93971cdb1f5c778144084242374473c350da,
1:0xc035a7cf15375ce2706766804551791ad035e0c2, 1:0xb3973d459df38ae57797811f2a1fd061da1bc123,
1:0x08b798c40b9ab931356d9ab4235f548325c4cb80, 1:0xec4ef66d4fceeba34abb4de69db391bc5476ccc8,
1:0x018008bfb33d285247a21d44e50697654f754e63, 1:0x4585fe77225b41b697c938b018e2ac67ac5a20c0,
1:0x779224df1c756b4edd899854f32a53e8c2b2ce5d, 1:0xc21b08c16458202593d4d9b26b9984ee67b38bbd,
1:0xbeef01735c132ada46aa9aa4c54623caa92a64cb, 1:0xbeefc1cdafc5b4a649b54d07afc6bf0f75c6f4e2
The API surfaces behind every figure are /v1/graph/breach and /v1/graph/look-through (preview), and the companion paper on the stablecoin failure modes this graph traces is Four Ways a Stablecoin Breaks.
References
-
Morpho (2026). Morpho Blue API, per-market bad debt. Accessed 2026-07-15. Extracted dataset committed at /data/the-recursion-map/morpho-bad-debt.json. ↩
-
Allen, F. & Gale, D. (2000). Financial Contagion. Journal of Political Economy 108(1). ↩
-
Acemoglu, D., Ozdaglar, A. & Tahbaz-Salehi, A. (2015). Systemic Risk and Stability in Financial Networks. American Economic Review 105(2). ↩
-
Eisenberg, L. & Noe, T. H. (2001). Systemic Risk in Financial Systems. Management Science 47(2). ↩
-
Singh, M. (2011). Velocity of Pledged Collateral: Analysis and Implications. IMF Working Paper WP/11/256. ↩
-
Singh, M. (2013). Collateral and Monetary Policy. IMF Working Paper WP/13/186. ↩
-
Heimbach, L. & Huang, W. (2024). DeFi leverage. BIS Working Papers No 1171. ↩
-
Durvasula, N. & Roughgarden, T. (2024). Robust Restaking Networks. arXiv:2407.21785. ↩
-
Gauntlet (2023). Interest Rates and Recursive Borrowers. Accessed 2026-07-15. ↩
-
Geanakoplos, J. (2009). The Leverage Cycle. NBER Macroeconomics Annual 24. ↩
-
Singh, M. & Aitken, J. (2010). The (sizable) Role of Rehypothecation in the Shadow Banking System. IMF Working Paper WP/10/172. ↩
-
Duffie, D. (2010). The Failure Mechanics of Dealer Banks. Journal of Economic Perspectives 24(1). ↩
-
White, M. (2023). Grayscale Bitcoin Trust: the free money machine that went into reverse. Citation Needed. Accessed 2026-07-15. ↩
-
Callahan, S. (2022). GBTC was the Genesis of the Crypto Credit Contagion. Swan Bitcoin. Accessed 2026-07-15. ↩
-
Nansen (2022). On-Chain Forensics: Demystifying stETH's "De-peg". Via the Internet Archive; the live page has been removed. ↩
-
Celsius Network (2022). A Memo to the Celsius Community. Via the Internet Archive; the live page has been removed. ↩
-
Sandor, K. (2022). 'Staked Ether' Becomes Focus of Crypto Stress, From Celsius to Three Arrows. CoinDesk. ↩
-
U.S. Commodity Futures Trading Commission (2022). CFTC Charges Sam Bankman-Fried, FTX Trading and Alameda with Fraud. Release 8638-22. ↩
-
DeFiLlama (2026). Historical DeFi TVL. Accessed 2026-07-15. ↩
-
Godbole, O. (2025). Stream Finance Faces $93 Million Loss, Launches Legal Investigation. CoinDesk. ↩
-
rekt.news (2025). House Of Cards. Published October 31, 2025, three days before the collapse. Accessed 2026-07-15. ↩
-
rekt.news (2025). The Loop Contagion. The post-mortem of November 18, 2025. Accessed 2026-07-15. ↩
-
Morpho Docs. Managing Bad Debt. Accessed 2026-07-15. ↩
-
Morpho Docs. Collateral, LTV & Health. Accessed 2026-07-15. ↩
-
Morpho Docs. Liquidation. Accessed 2026-07-15. ↩
-
Lido (2021). One Month of Lido. Accessed 2026-07-15. ↩
-
Vardai, Z. (2024). Concerns mount over Ethena USDe's promise of 27% yield following mainnet launch. Cointelegraph. Accessed 2026-07-15. ↩
-
DeFiLlama (2026). EigenLayer protocol TVL. Accessed 2026-07-15. ↩