
The Expensive Model That Did Not Beat Size
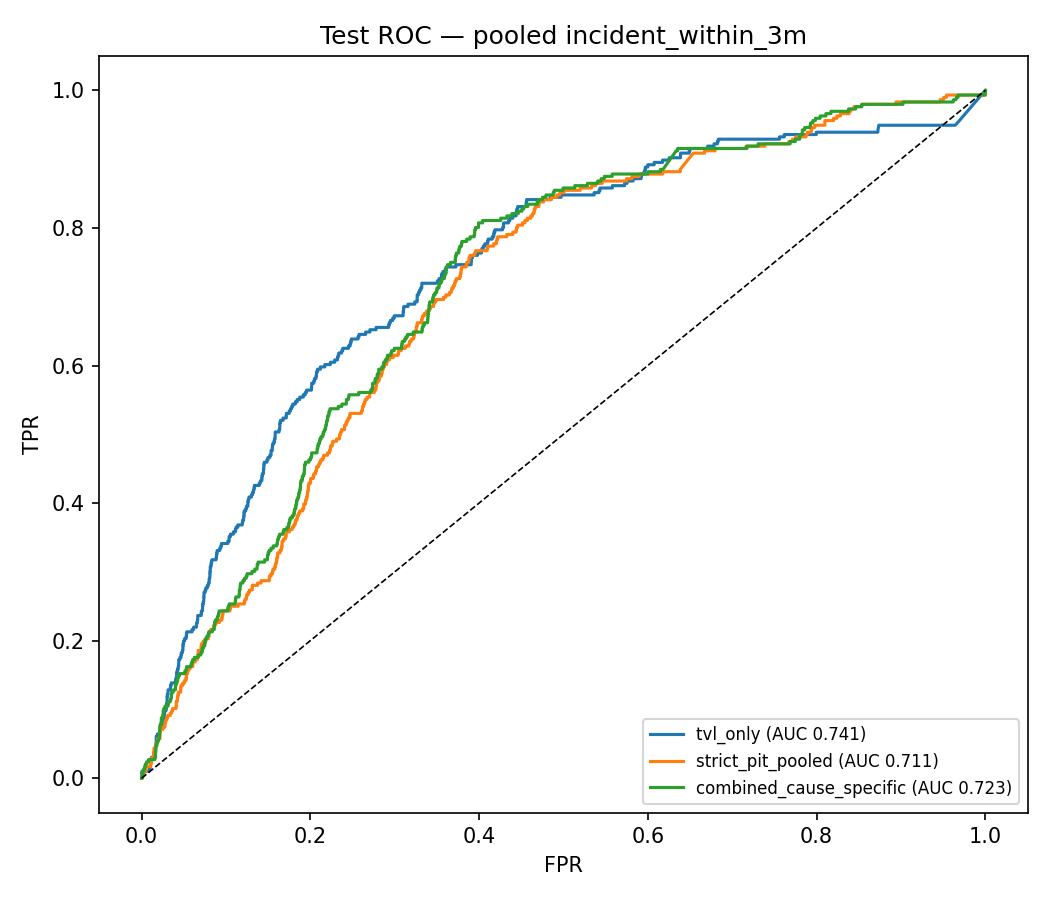
The most expensive modeling effort in this program set out to beat a one-variable model, and lost. Four hypotheses went in with their pass conditions written down in advance. Three failed. The expensive model split failure risk by cause, four families of failure fitted together, and still did not rank incident risk better than lagged protocol size, meaning size measured one month earlier so the comparison cannot peek at the future. Lagged size held its champion score of 0.741, where a higher score is better at separating the protocols that went on to fail from those that did not. The one claim that passed is the one an allocator can use. When protocols fail, the loss grows far more slowly than the protocol itself. After adversarial correction the relationship is an elasticity of 0.34 to 0.55, the rate at which loss grows relative to size, well below one for one. Expected loss is therefore shaped by how often things break, not by how much breaks at once.
This document is the lab report behind those verdicts, kept in its registered structure, with the same-day adversarial corrections printed inline where they landed. The allocator-facing narrative built on these experiments lives in How DeFi Protocols Fail; what follows is the machinery, for readers who want to check the work.
5eee78d3e77fc51dd51075a08ad6fd557adb87a1e7b98a08780b0908a8ead46e, Dataset manifest SHA-256 (built 2026-07-06T15:14:18.783Z)
- Publication artifact hash:
SHA-256 over the generated MDX, figures, and public data artifact set
Background and prior work
This experiment splits risk into two questions. How often do protocols fail, and how much is lost when they do. That split, frequency times severity, is the standard frame in operational-risk research, and its hardest lesson transfers intact. Moscadelli's analysis of the Basel Committee's collected loss data found tails so heavy that variance is infinite in every business line,1 expected loss lives in the extremes, which is exactly what H4's failure rediscovered on-chain. The DeFi record now matches the shape. Chainalysis reports the ratio between the largest hack and the median crossing 1,000x,2 and Zhou and coauthors' incident systematization supplies the academic mechanism taxonomy our four hazard groups descend from.3 Prior work established the frame and the tails. This experiment is the first to run the frame pre-registered on a DeFi panel and publish every verdict, and its allocator-facing narrative lives in the companion paper.4
Generated figures
Experiment report
Program: Philidor hazard-model (external incident labels) · Owner: Claude (Fable 5) · Date: 2026-07-06
Lineage: Phase 2/3 hazard-baseline-20260703 (baselines; TVL-only wins), Phase 4a/4b graph-incident-bridge-20260703 (51% label coverage; graph bridge cross-section).
Scope
Three questions, answered on the existing 51%-coverage protocol-month panel (46,838 rows, 2019-01..2026-06) with NO new covariates and NO panel rebuild:
- Decomposition. Do cause-specific (mechanism-group) hazard models differ from each other, and does their combination rank pooled incident risk better than the reigning champion (lagged log-TVL alone)?
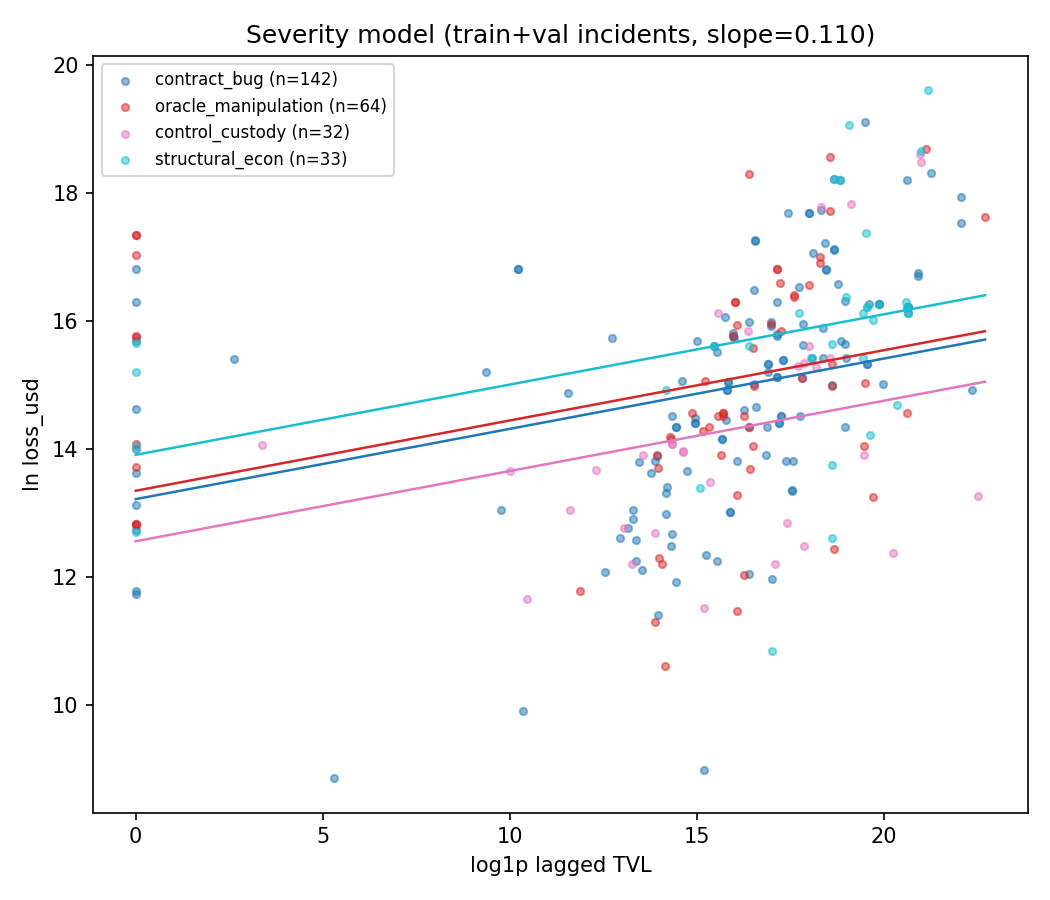
- Severity. Is loss-given-incident predictable from protocol size and mechanism, and is it sublinear in TVL?
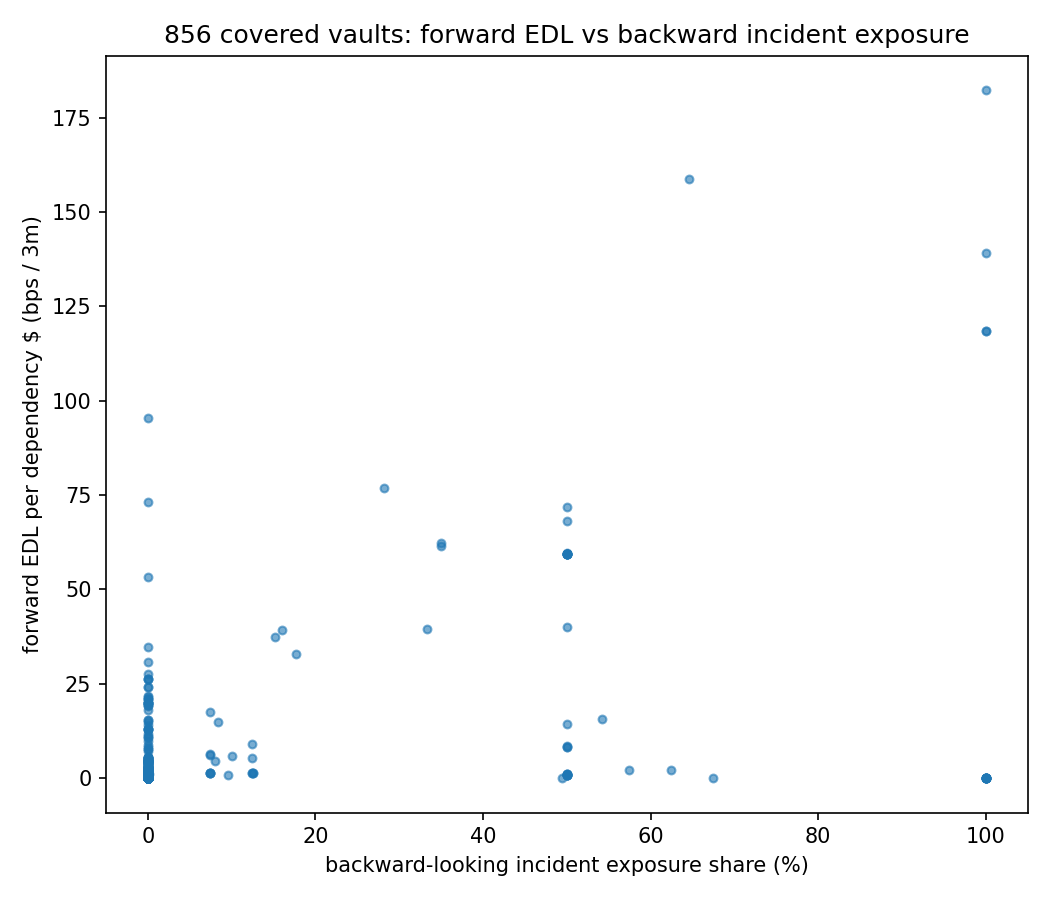
- Expected loss. Does ranking protocol-months by expected loss = Σ_g h_g × E[L|g,TVL] capture more realized test-period loss dollars than ranking by size? Then, report-only, propagate per-issuer expected loss through the production graph-bridge closures to produce a forward-looking expected dependency loss (EDL) per covered vault.
Mechanism groups (locked before any fitting, grouped by data-generating-process kinship; attached in-panel incident counts in parens, train/val/test = 208/63/128 total):
| Group | Registry mechanisms | Attached incidents (total; test) |
|---|---|---|
contract_bug | contract_bug | 211; 69 |
oracle_manipulation | oracle_manipulation | 89; 25 |
control_custody | admin_key, governance, custody_offchain | 55; 23 |
structural_econ | bridge, economic_design, depeg_collateral, dependency_contagion, unknown | 44; 11 |
Pre-registration
- Primary metric + evaluation protocol.
- Discrimination: unweighted ROC-AUC and top-decile lift (positive rate in top 10% of test rows by score ÷ overall test positive rate) on the pooled
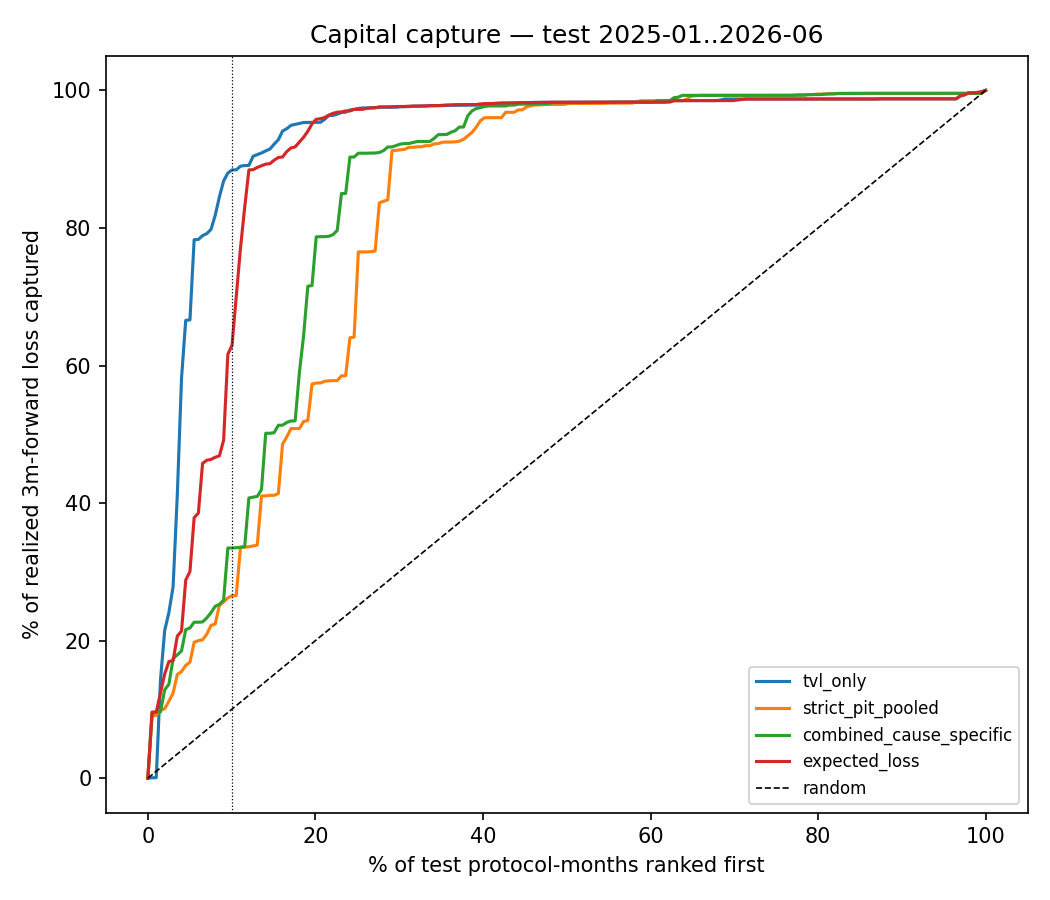
incident_within_3mtarget, test split = months 2025-01..2026-06, single one-shot evaluation. All models AND baselines are evaluated by this experiment's own eval code (Phase 4a numbers are external reference only). - Capital capture: share of total realized test-window loss captured by the top decile (by row count) of a ranking. Realized loss of row (slug, m) = Σ
loss_usdof attached incidents in months m..m+2 (same window as the hazard target). Only incident-protocol rows carry loss and all have sampling_fraction = 1.0, so control sampling cannot distort the numerator or denominator; overlapping windows triple-count identically for every ranking compared. - Uncertainty: clustered-by-slug nonparametric bootstrap, 200 reps, seed 42. ΔAUC: resample test-split slugs with models held fixed. Coefficient contrasts and severity slope: resample train+val slugs and refit.
- Weighted (inverse-sampling-fraction) AUC variants, PR-AUC, and per-group AUCs are report-only.
- Discrimination: unweighted ROC-AUC and top-decile lift (positive rate in top 10% of test rows by score ÷ overall test positive rate) on the pooled
- Baseline to beat.
- Discrimination: TVL-only logistic (single covariate
log1p_tvl_lag1), refit and re-evaluated here. External reference: test AUC 0.741, top-decile lift 3.4 (Phase 4a re-run). The pooled strict-PIT 7-feature logistic is recomputed as a second reference. - Capital capture: ranking test rows by
log1p_tvl_lag1(size ranking), the incumbent "attackers go where the money is" heuristic.
- Discrimination: TVL-only logistic (single covariate
- Budget. Single machine, one
uv run python run.py --config params.yamlinvocation, target < 20 min wall-clock. 200 bootstrap reps × (4 group GLMs + 1 severity OLS refits) + 200 eval-side reps. No hyperparameter search (unpenalized GLMs; deterministic ridge fallback 1e-6 only on numerical failure, noted if used). Application stage may fetch ≤ ~120 missing issuer TVL series from api.llama.fi with an on-disk cache; everything else is local. - Independent variables. Changed: (a) decomposition of the outcome into the 4 pre-named cause-specific targets, with the combined score 1 − Π_g(1 − h_g); (b) addition of a severity model, an OLS of log(loss_usd) on log1p_tvl_lag1 + mechanism-group dummies, fit on train+val attached incidents only; per-group lognormal variance shrunk toward pooled with k = 20; per-incident expected loss capped at lagged TVL; (c) the EL ranking and the report-only vault EDL application. NOT changed: the 7 strict-PIT features (age_months, log1p_tvl_lag1, tvl_growth_3m, tvl_growth_3m_missing, tvl_drawdown_6m, prior_incidents, months_since_last_incident), the panel, splits, seed (42), sampling design and weights (var_weights = sample_weight in all GLM fits), no test-set tuning of any kind.
- Success / failure criteria.
- H1 (mixture beats size): combined cause-specific score beats TVL-only on test ROC-AUC by ≥ +0.02 AND the clustered-bootstrap 95% CI of ΔAUC excludes 0. Failure: either condition unmet.
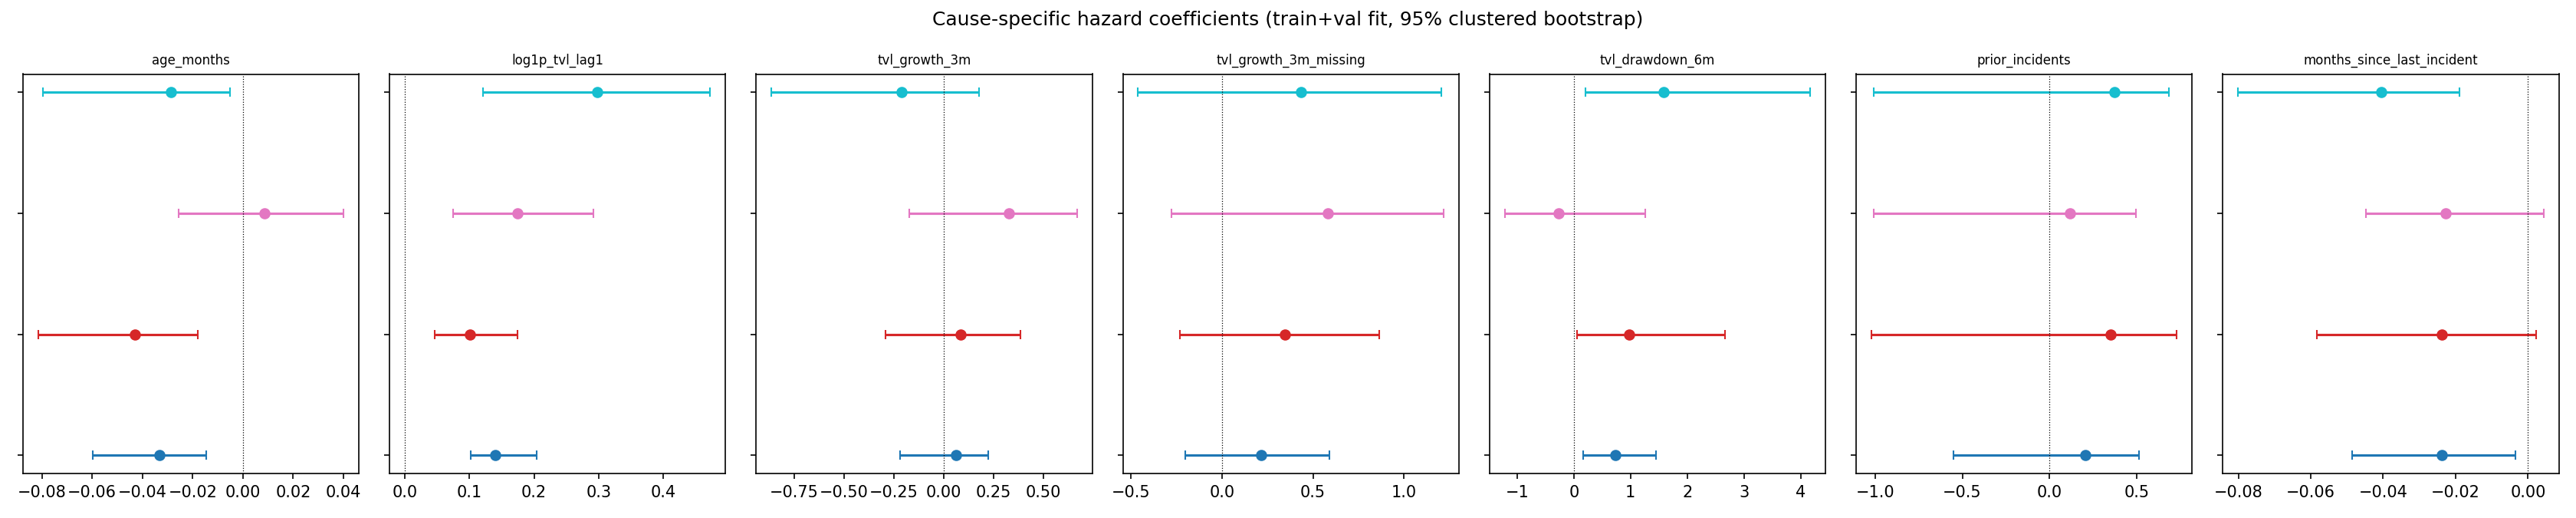
- H2 (mechanism heterogeneity): two pre-named coefficient contrasts, Bonferroni-adjusted (97.5% CIs): (a)
log1p_tvl_lag1: contract_bug vs control_custody; (b)age_months: contract_bug vs control_custody. Success: at least one adjusted CI excludes 0. Rationale fixed a priori: contract/oracle attacks are attacker-opportunity-driven (TVL-elastic, age-protective via battle-testing); control/custody failures are insider-driven (less TVL-elastic, not age-protective). Failure: both CIs include 0. - H3 (severity sublinearity): TVL slope in the severity OLS < 1 with clustered-bootstrap 95% CI excluding 1. Failure otherwise.
- H4 (capital capture): top-decile capital capture of the EL ranking ≥ 1.15 × that of the TVL ranking on test. Failure otherwise.
- The vault EDL application is report-only (single cross-section, no historical closures exist to backtest it) and carries no claim.
Validation gates (abort on failure, before any model fit): per-row OR of the 4 cause-specific within_3m targets must equal the panel's incident_within_3m; per-row sum of cause-specific in-month counts must equal incident_count_in_month; attached-incident counts per split must equal 208/63/128.
Leakage discipline: all covariates already strict-PIT (lagged to m−1) per the Phase 2 data dictionary; cause-specific targets are outcome decompositions, never features; severity model sees train+val incidents only; test evaluated exactly once, after all code paths ran green on train/val.
Results
Run: phase5-main, seed 42, wall clock 23.1s, 200/200 valid bootstrap reps in both loops, zero ridge fallbacks (all GLMs converged unpenalized). Validation gates all passed (per-row OR/count identity with the Phase 2 panel; attached-incident split counts 208/63/128). Determinism verified by re-execution (identical metrics).
1. Observations
Pre-registered verdicts: H1 FAIL · H2 FAIL · H3 PASS · H4 FAIL.
Test discrimination (pooled incident_within_3m, 2025-01..2026-06):
| model | test ROC-AUC | PR-AUC | top-decile lift | weighted ROC-AUC (report-only) |
|---|---|---|---|---|
| tvl_only (champion) | 0.741 | 0.040 | 3.41 | 0.758 |
| strict_pit_pooled | 0.711 | 0.029 | 2.43 | 0.758 |
| combined_cause_specific | 0.723 | 0.032 | 2.43 | 0.770 |
| expected_loss (as ranker) | 0.742 | 0.037 | 3.07 | 0.767 |
- H1: ΔAUC(combined − tvl_only) = −0.019, clustered-bootstrap 95% CI [−0.056, +0.017]. Required ≥ +0.02 with CI > 0. FAIL.
- H2:
log1p_tvl_lag1contrast (contract_bug − control_custody) = −0.034, 95% CI [−0.151, +0.090], which is null.age_monthscontrast = −0.042, 95% CI [−0.076, −0.004] (excludes zero unadjusted) but Bonferroni-adjusted 97.5% CI [−0.082, +0.001] narrowly includes zero. FAIL by the pre-registered bar, though directionally exactly as hypothesized (age protects against contract bugs, not against control/custody failures). - H3: severity slope on log1p lagged TVL = 0.110, 95% CI [0.064, 0.171], far below 1. PASS.
Loss-given-incident is nearly size-invariant (median test-era loss ≈ $2M whether the protocol holds $10M or $10B).[Corrected in review: the 0.110 point value is attenuated by 24 first-panel-month incidents coded at log1p_tvl=0 where lagged TVL is structurally unobservable; handled, the slope is 0.34–0.55 and train+val median loss rises $1.1M→$61.7M across TVL buckets. Sublinearity (≪1) survives all attacks, see §Adversarial review.] Residual σ² ≈ 3.0–3.5 (lognormal, heavy spread), group intercept differences modest. - H4: top-decile capital capture: tvl_only 88.4%, expected_loss 62.9%, combined 33.5%, strict_pit 26.6%. Ratio EL/TVL = 0.71 < 1.15. FAIL.
- Per-group own-target test AUCs (report-only): structural_econ 0.739, oracle_manipulation 0.704, contract_bug 0.698, control_custody 0.665.
- Realized test losses are tail-dominated: 128 incidents totalling $1.42B, and the top 5 are 73.7% of it. Those are drift-trade 2026-04 ($295M, oracle, 96% of protocol TVL), kelp 2026-04 ($293M, bridge, 23%), cetus-clmm 2025-05 ($223M, contract, 107%), and balancer-v3/v2 2025-11 ($238M combined, 25–39%).
Application (report-only): 64/65 role=issuer dependency slugs scored (ripple-usd skipped, no TVL series). [Corrected in review: initially misreported as 70/71; six mapped slugs are venue/underlying-role-only (pendle and its 13 PT wrappers, curve-dex, stake-dao, velodrome-v2, usdd, inverse-finance-firm) and are excluded from EDL by construction, making the per-vault figures a stricter lower bound than first stated.] Per-vault forward expected dependency loss computed for all 856 covered vaults; 516 have EDL > 0. Aggregate EDL ≈ $3.11M per 3-month horizon (~1.6 bps/3m on the mapped 44.7% of dependency dollars; a lower bound by construction and biased down by the tail issue below). Top issuer hazards are credible: resupply (2 prior incidents, 16 months old) 2.5%/3m expected loss per exposed dollar, yearn-finance (9 priors) 1.4%, alchemix-v3 (3 months old) 1.4%. Spearman between forward EDL/$ and the backward-looking incident-exposure share across vaults = 0.297, so the forward ranking is genuinely different information, not a re-ranking of the Phase 4b flag. Kelp, the #2 realized test loss, is the top EDL contributor of the #1 EDL vault ($748M Aave vault, $625k EDL), driven by exposure size plus its now-elevated prior-incident hazard.
2. Interpretation
The success criteria were not met for H1/H2/H4; H3 was met decisively, and it is the load-bearing finding. Three prior-phase conclusions are now sharpened:
- Size is the hazard signal, and mechanism decomposition adds nothing to unweighted discrimination (H1), consistent with Phases 3/4a. The one crack in the wall is that on the population-weighted view (small protocols reweighted up), the mechanism mixture beats TVL (0.770 vs 0.758, report-only). Mechanism structure seems to matter exactly where the sampled, size-dominated benchmark can't see it.
- Severity and frequency are structurally different. Hazard rises with size; loss-given-incident barely does (slope 0.11). Expected loss is therefore hazard-shaped, not severity-shaped, at the center of the distribution.
- Capital capture is decided by the biggest few losses, and the severity model's typical-loss estimate misses those extremes (H4). The biggest losses are near-total-drain events at mid-size protocols, mechanically bounded by TVL (you cannot lose $300M from a $50M protocol). Ranking by size captures dollars because size is the loss ceiling, while our EL model, honest about the sublinear center, understates the ceiling-hitting tail and gives back 25 points of capture.
3. Hypothesis (mechanism explaining the result)
Loss-given-incident is a two-regime mixture. There is a size-invariant "bounded exploit" regime (median ≈ $2M, meaning bug bounty-scale drains and single-pool exploits) that dominates counts, and a rare "ceiling" regime where the attacker drains a large fraction of TVL (drift 96%, cetus 107%). A single lognormal with one TVL slope averages the regimes and misses the second. Capital capture is decided almost entirely by the ceiling regime, whose loss size is proportional to TVL, which is why raw TVL ranking is nearly unbeatable on dollars, and why any EL model that wants to match it must model P(near-total drain) rather than E[log loss].
4. Next experiment
Tail-exceedance expected loss. Replace the lognormal severity mean with a two-part model on the same panel: (a) keep cause-specific hazards; (b) model the loss-share s = loss/TVL[m−1] per incident with a mixture, using logistic exceedance P(s > 0.2 | incident, group, size) plus conditional means for the two regimes (or a generalized Pareto on s). EL_tail = h × TVL × E[s]. Pre-register: (i) top-decile capital capture ≥ 0.85 (vs 0.63 now, TVL at 0.88); (ii) within the top TVL quintile of test rows (the protocols allocators already watch), EL_tail ranks realized losses better than TVL (positive clustered-bootstrap Spearman gap). Also carry the suggestive H2 age×contract_bug interaction as a single pre-named contrast (no Bonferroni split) with the 51% panel, since it was significant unadjusted and directionally as theorized.
5. Prediction
The exceedance-based EL reaches top-decile capital capture 0.83–0.90 (within noise of TVL-only), and within the top TVL quintile achieves a positive Spearman with realized 3m loss where TVL-only is ≈ 0 by construction (point prediction: ρ ≈ +0.15 ± 0.10). If the within-quintile gap is null too, the honest conclusion is that dollar-loss ranking beyond size is not learnable at this label coverage, and the program should pivot fully to the weighted/per-dollar view where mechanism structure already shows signal.
Repro & artifacts
uv run python run.py --config params.yaml (deterministic, seed 42; DeFiLlama fetches cached under data/cache/tvl_apply/). Artifacts: metrics.csv (69 rows), summary.json, figures/f1..f5, data/vault_expected_dependency_loss.csv (856 vaults), data/issuer_hazard_scores.csv (64 issuers). Note: research_reports/ is gitignored by house convention (large local artifacts); the program-level summary lives in docs/research/2026-07-06-mechanism-expected-loss.md.
Limitations
Inherited from Phases 2–4 (as-recorded-today TVL, 51% label coverage, machine-reviewed labels, stratified-negative design → ranking metrics valid within the sampled population). New here: the severity model is fit on 271 train+val incidents pooled across eras (no drift term); the EDL application uses a single closure snapshot (no PIT backtest possible until closure history exists); loss-share ratios can exceed 1 (cetus 1.07) because DeFiLlama TVL is not the exact exploitable base; per-incident expected loss is capped at lagged TVL, which the ceiling regime shows is sometimes wrong.
Adversarial review corrections (2026-07-06, post-publication)
A 4-lens adversarial panel (statistics-refutation, code/leakage audit, 5b design review, roadmap critique; Codex cross-model pass deferred to 2026-07-07 on quota) reviewed this report the same day. All pre-registered VERDICTS stand (H1 FAIL, H2 FAIL, H3 PASS, H4 FAIL); every published number reproduces bit-for-bit; target construction, severity-fit isolation, bootstrap implementation, and apply-stage PIT handling were verified clean. The following claims and numbers are corrected or downgraded:
- RETRACTED, the §2.1 weighted-AUC "crack" (0.770 vs 0.758). Under this experiment's own eval-side clustered-bootstrap standard the weighted ΔAUC CI is [−0.021, +0.046] (P(≤0)=0.235), which is noise. It also fails a consistency check (the 7-feature pooled model shows Δ=+0.0002). Do not cite as evidence that "mechanism structure matters among smaller protocols." (Exploratory footnote: the expected_loss ranker's weighted Δ CI is [+0.0004, +0.0180], borderline and unregistered, and would need its own pre-registration.)
- CORRECTED, H3's point value and framing. The 0.110 slope is attenuated by 24/271 fit incidents at log1p_tvl=0 (21 are first-panel-month rows where lagged TVL is structurally unobservable, e.g. harvest-finance 2020-10, $58.8M loss coded as zero-TVL). Excluding x=0: slope 0.336 [0.233, 0.471]; also excluding loss>TVL rows: 0.546 [0.463, 0.649]; Huber/median/winsorized variants 0.11–0.12 only when x=0 rows are retained. Train+val median loss by TVL bucket: $1.1M / $4.9M / $11M / $61.7M, monotone, not flat. The correct statement is that severity is decisively sublinear (elasticity ~0.3–0.55, ≪1), not size-invariant. The 0.110 slope propagates into the EL ranker and the $3.11M EDL total, both biased low for large issuers.
- DOWNGRADED, the H4 capture-gap narrative. The 88.4% vs 62.9% gap has eval-side clustered-bootstrap CI [−0.014, +0.507] (3 slugs carry 57.7% of test loss dollars): TVL's dollar superiority is "not rejected," not "established." Band sensitivity: at top-1% TVL captures 0.1% vs EL 9.6%; at top-20% EL ≥ TVL; excluding the top-10 loss events EL 0.430 > TVL 0.377. "Size is mechanically the loss ceiling" holds only in the 5–10% band that the pre-registered metric happened to score.
- CORRECTED, apply-stage coverage prose. 64/65 role=issuer slugs scored, not 70/71 (six venue/underlying-role-only slugs, incl. pendle's PT wrappers, are excluded by construction). Artifacts (metrics.csv, issuer CSV) were always correct; the report text miscounted.
- DISCLOSED, 2-month fit/test label overlap. Fit rows 2024-10..12 have 3m outcome windows reaching into 2025-01/02 (test): 10/604 fit positives exist solely via test-period incidents. Embargo sensitivity (drop 2024-11/12 from fit): no verdict flips; H1 gap −0.019→−0.016; EL capture 0.629→0.767 (H4 ratio 0.712→0.867, still FAIL). Roughly half the "gives back 25 points of capture" quantum is attributable to boundary-straddling fit rows. Inherited from the Phase 2 split design; symmetric across models.
- DISCLOSED, exit-month death censoring. 11 matched test-period incidents ($132.5M; e.g. stream-finance 2025-11 $93M, zklend 2025-02) fall outside their protocol's [entry, exit] TVL interval, so these drain-to-death events are excluded from the panel outcome and the $1.42B capture denominator. This censors exactly the ceiling-regime events the §3 hypothesis concerns; Phase 5b must handle it (pre-registered grace-window sensitivity).
- MINOR, wording. GLMs use freq_weights (point-estimate-identical to the registered var_weights for Binomial; CIs are bootstrap); "median test-era loss ≈ $2M" was loose (empirical attached-test median $1.32M); end-of-window truncation (2026-05/06) is symmetric and doesn't affect orderings.
- SUPERSEDED, §4 Next experiment. The 5b pre-registration as drafted had a degenerate primary bar (h×TVL scores 0.870 ≥ the 0.85 bar with no severity information; TVL itself misses 0.85 in ~40% of bootstrap worlds), a false premise ("TVL ≈ 0 within the top quintile", measured +0.042), and a guaranteed-pass carried contrast. The amended, panel-reviewed pre-registration lives in
docs/research/2026-07-06-research-plan-post-review.md. Its key computed inputs: exceedance P(s>0.2) is strongly size-dependent (logit slope −0.575, z −6.7; 126 train+val exceedances, EPV 25, pooled-with-group-dummies only); GPD on raw s rejected (contamination to s=376,923, diverging mean-excess); the drain-hazard target P(loss3m > 0.2·TVL) shows val AUC 0.691 vs TVL-only 0.613, the largest beyond-size gap in the program, and is carried as the pre-registered secondary model.
Revisions
- 2026-07-15 Retitled and reframed results-first with a plain-language abstract; added the background and prior-work section with fetch-verified numbered references. All experiment content, verdicts, corrections and pinned figures unchanged.
References
-
Moscadelli, M. (2004). The modelling of operational risk: experience with the analysis of the data collected by the Basel Committee. Banca d'Italia, Temi di discussione No. 517. ↩
-
Chainalysis (2025). 2025 Crypto Theft Reaches $3.4 Billion. 2026 Crypto Crime Report. Accessed 2026-07-15. ↩
-
Zhou, L. et al. (2023). SoK: Decentralized Finance (DeFi) Attacks. IEEE Symposium on Security and Privacy. ↩
-
Philidor Research (2026). How DeFi Protocols Fail: Three Findings from an Honest Backtest. ↩