
How DeFi Protocols Fail, Three Findings from an Honest Backtest
Over seven years of public DeFi history, three things held up. The data covers 46,838 protocol-months, meaning a row for every month a tracked protocol was live, across the part of the market we cover.
Bigger protocols get hacked more often. Ranked by size alone, the top tenth of protocols went on to have 3.4 times more incidents than average, and nothing more sophisticated we tested beat that simple ranking. But bigger failures are not proportionally bigger. A protocol ten times larger typically loses only two to three times more when it fails. And the dollars concentrate brutally. Five events out of 128 accounted for almost three quarters of everything lost in our sample's final eighteen months.
Where these numbers come from. We track about half of the public incident record, roughly $42B of the $73B in DeFi. Across the whole market, DeFi protocol hacks since 2019 total about $4.4B if you exclude cross-chain bridges. All crypto hacks on record total about $16.7B (DeFiLlama, July 2026). The $1.42B below covers our sample's eighteen-month test window rather than the market as a whole.
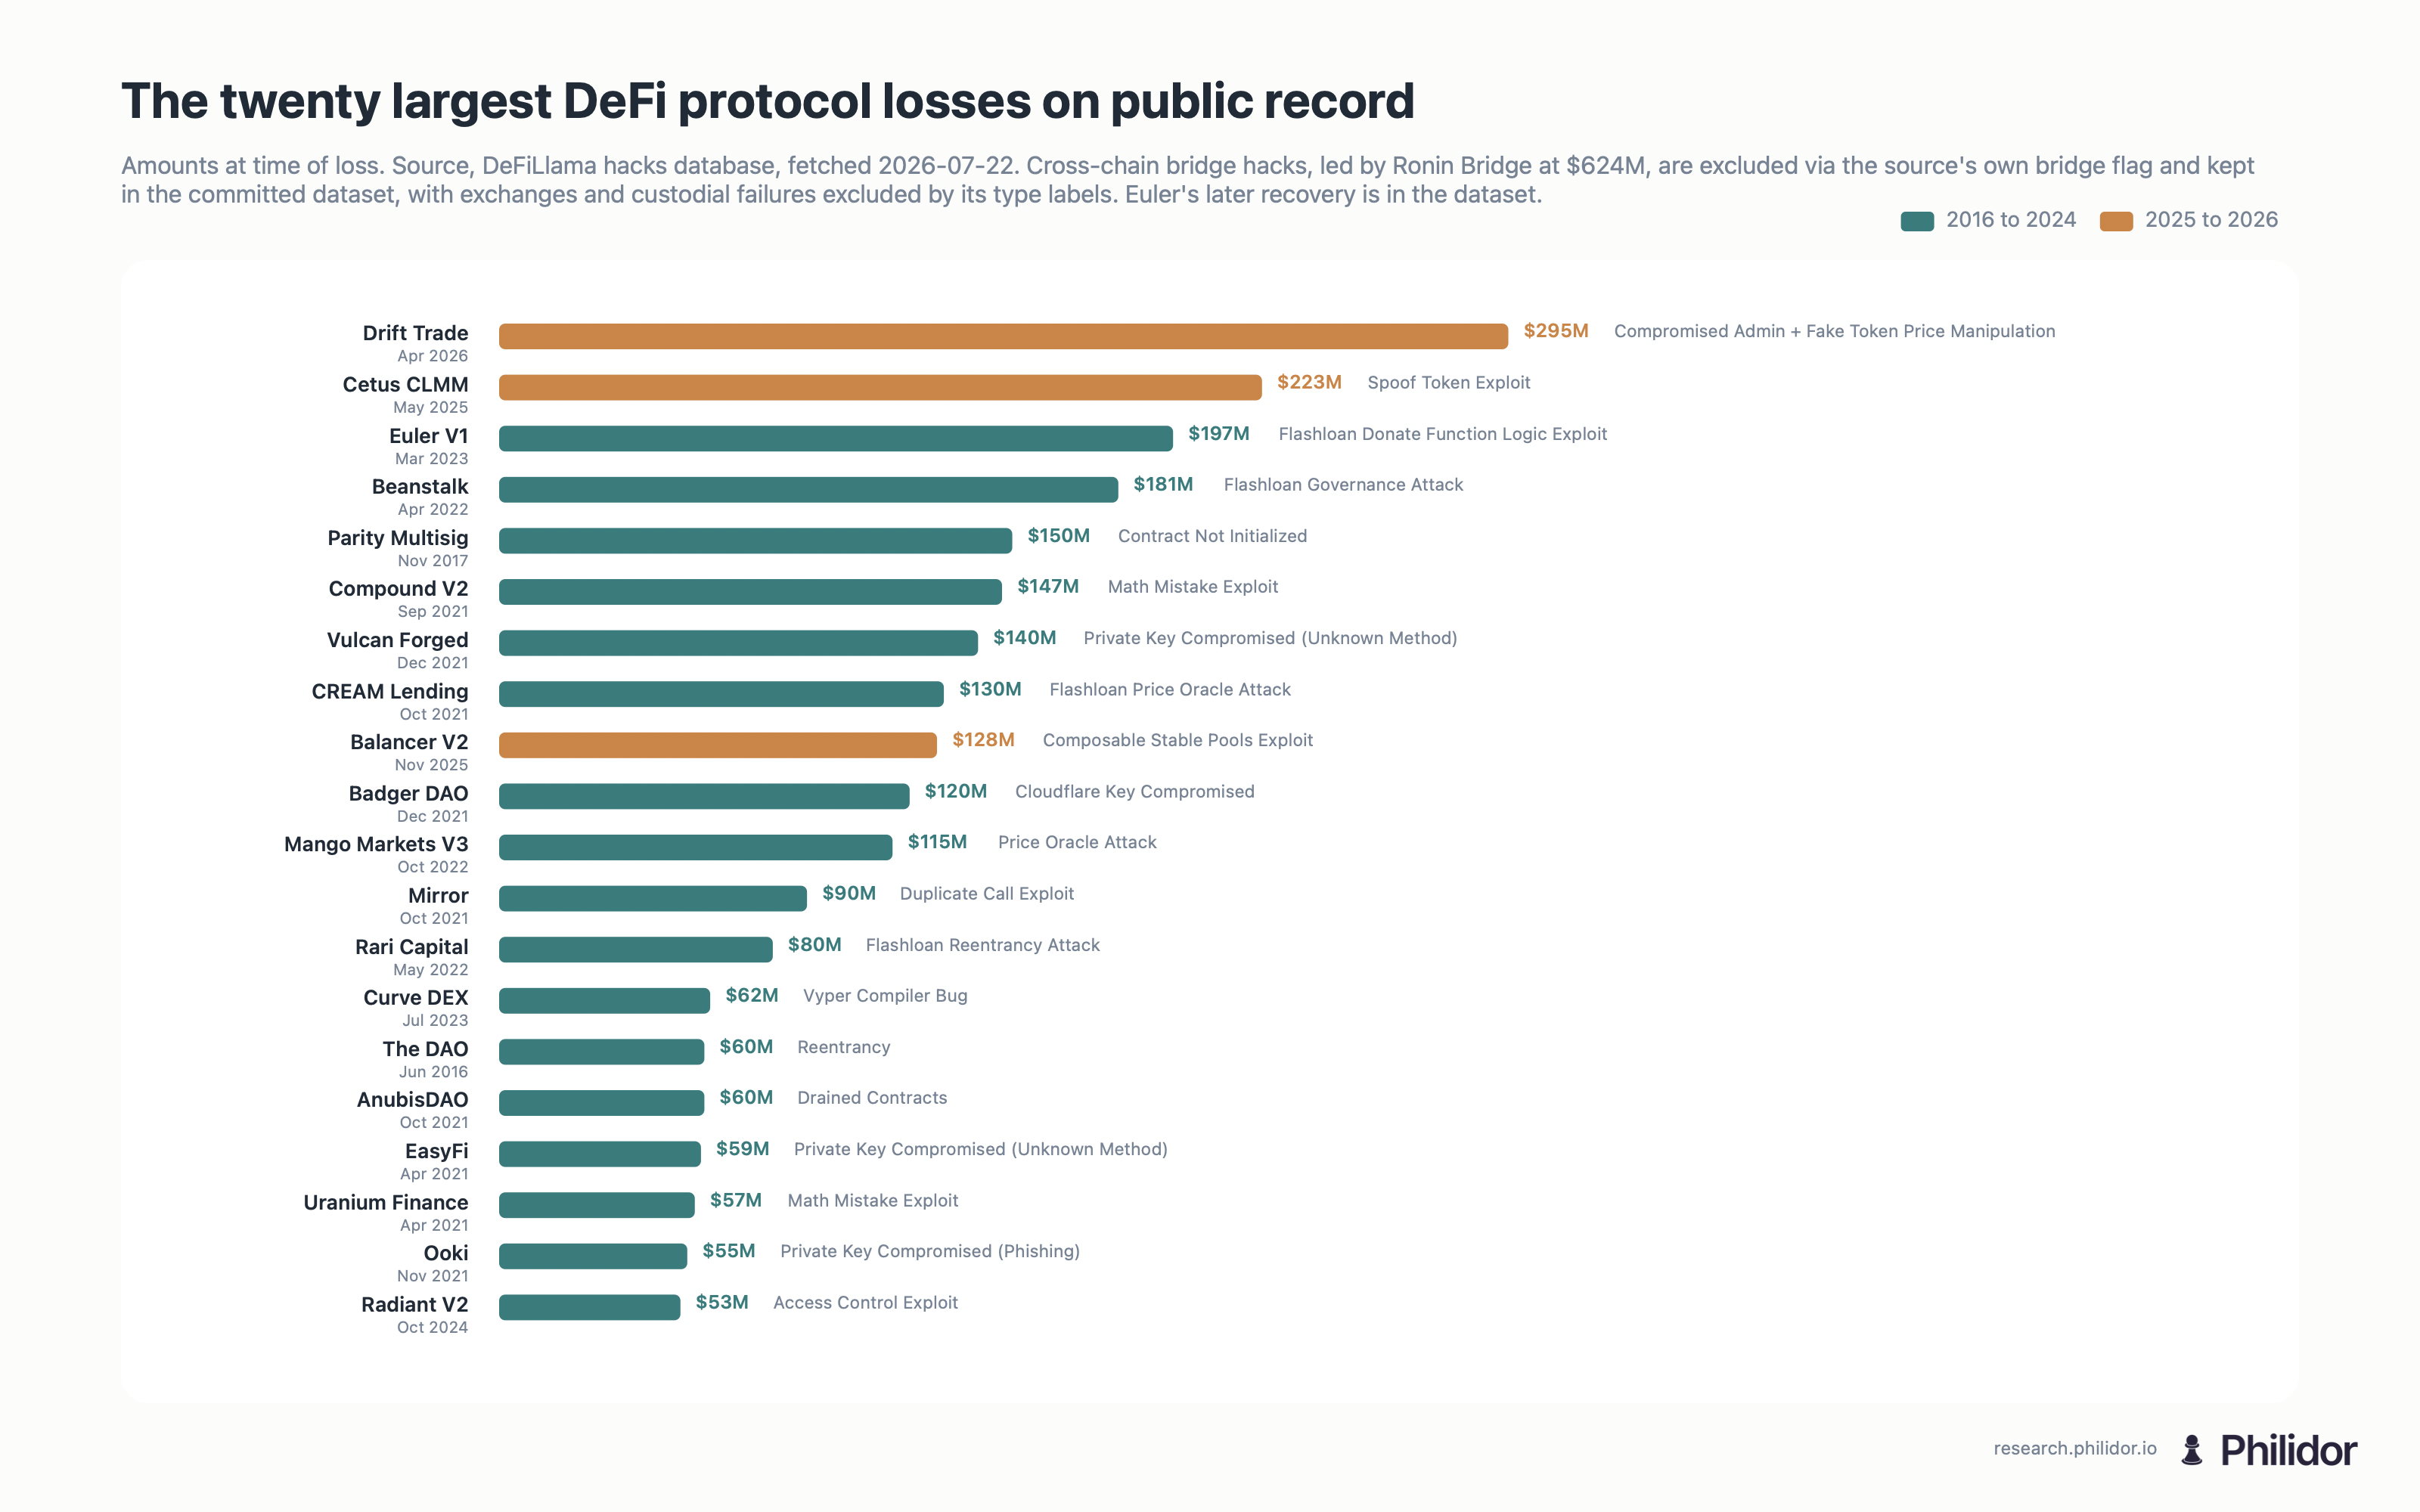
For scale, here are the twenty largest DeFi protocol losses on public record, with cross-chain bridge hacks excluded.1 Bridges are infrastructure between chains rather than DeFi protocols, and several of the largest bridge failures, led by Ronin at $624M, were custodial designs. The chart shows the public record. The findings in this paper are measured on our tracked sample.
What we found
Where the money goes, incidents follow. We built a model with one input, the protocol's size a month earlier. On data it had never seen, it told apart the protocols that went on to have a recorded incident from those that stayed clean, and it did so better than anything else we tested. The riskiest tenth by size had 3.4 times more incidents than average. Two cautions belong next to that. Incidents are rare in any given month, so even a good ranking flags many protocols that stay quiet. The full metrics, including precision and recall, are in the committed evaluation table. And a protocol with no recorded incident is not thereby proven safe.
Losses grow far more slowly than size. A protocol ten times larger typically loses only two to three times more when it fails. Economists call that ratio an elasticity. Ours lands between 0.3 and 0.55 in this panel, meaning this particular set of protocol-months. An elasticity of 1 would mean losses growing in step with size. An earlier fit of 0.11 was corrected in review, so treat the range as this panel's estimate rather than a market constant. Early readers raised the structural reason independently. The part of a protocol an attacker can actually reach is smaller than its headline size. Isolated markets, per-asset caps and partial deployments bound what a single bug or one bad asset can reach. For an allocator, that means expected loss away from the tail is driven by how often venues break, rather than by how much breaks at once.
The tail carries the dollars. The test window holds 128 incidents totalling $1.42B, and five events carry 73.7 percent of it. The largest, Drift Trade in April 2026, took 96 percent of its protocol's reported value in one event. Kelp's $293M deserves a note, because this paper's bridge handling has been corrected once already. Kelp is a DeFi restaking protocol, and the part of it that was exploited was its cross-chain bridge. That puts it inside our sample, which we build by protocol, and outside the chart above, which excludes bridge exploits. Count it out and the window totals roughly $1.13B, with the remaining four events still carrying about two thirds. The concentration survives either way. One more count matters here. Roughly eleven incidents where a venue was drained until it shut down, worth about $132.5M and including Stream Finance, fall outside the months our panel tracks. So the tail here is undercounted rather than inflated.
How we tested it
Incidents count from the date they were publicly disclosed. Protocols that died stay in the sample. We graded the model against public incident records that our own scoring cannot touch, using 2025 through mid-2026 data the model had never seen.
One example of why this matters. Precision means the share of the protocols a model flags that really do go on to have an incident. An early export of our own predictive tables showed a top-decile precision of 1.00, a perfect score among the protocols the model ranked most at risk. That is the number every risk desk wants to print. We then rebuilt the test so the model could only see what was public on each prediction date, and precision fell to 0.20. Nothing about the model changed. The evaluation simply stopped letting it see the future. The table below shows why that perfect score was hollow. When 91 percent of a naive test set already contains protocols that were hit, a perfect precision score is arithmetic rather than skill.
| Run | Rows | Positive base rate (share of rows that were hits) | Top-decile precision (hit rate among the riskiest-ranked group) | AUROC (how well the model ranks hits above non-hits, where a coin flip sits at the midpoint) |
|---|---|---|---|---|
| Naive | 196 | 91.3% | 1.00 | 0.532 |
| Point-in-time | 41 | 65.9% | 0.20 | 0.516 |
What an allocator does with this
Budget monitoring attention by venue size, because the chance of an incident tracks size and nothing we tested beats it yet. Treat near-total-drain risk as the severity that moves a portfolio. And treat any vendor's signal, including ours, as unproven until someone has graded it on data the model never saw, against a pass mark written down in advance. One thing this paper does not license is a portfolio rule that haircuts venues by size. A loss elasticity measured on one panel says how losses scaled here, rather than how to size positions.
Data and sources
The scorecard in Figure 2 comes from
prod-evaluation.json,
a read-only export stamped 2026-07-07T13:54:04Z. The discrimination
metrics, including the precision-recall figures, are in the
experiment report of 6 July 2026. The chart data is committed at
/data/the-honest-backtest/top-defi-losses.json,
from DeFiLlama's public hacks database.1
References
-
DeFiLlama (2026). Hacks database. Accessed 2026-07-22. Filtered to DeFi protocols excluding bridge hacks per the source's bridgeHack flag; extracted dataset committed at /data/the-honest-backtest/top-defi-losses.json. ↩ ↩2