
Loans, Not Lockups
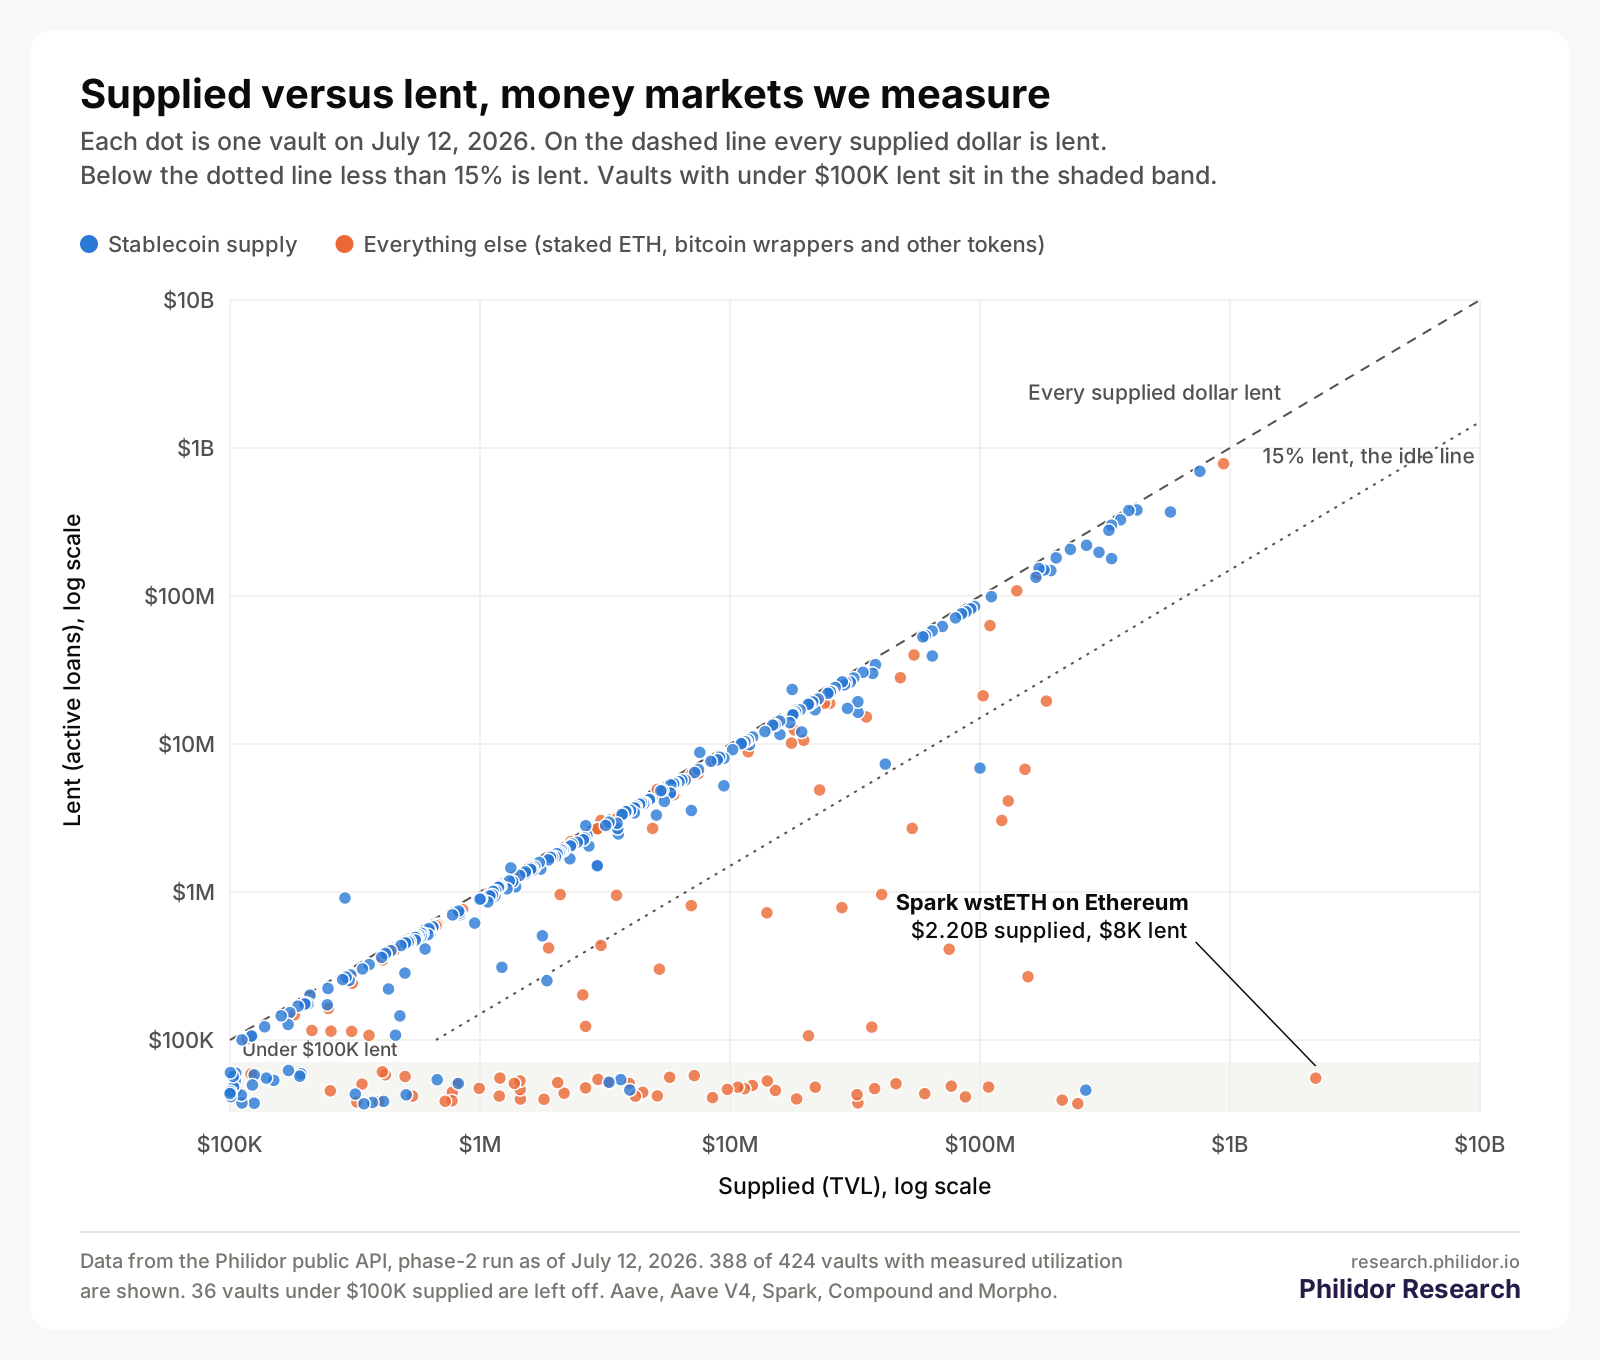
On July 12, 2026, Spark's wstETH market on Ethereum held $2.20B of deposits, and $8K of it was out on loan. By total value locked it ranked fourth among the 524 money-market vaults we track. As a lending business it barely registers. wstETH is liquid-staking ether, an asset lending markets mainly use as collateral,1 and its quoted supply rate was below 0.01% because almost nobody borrows it. Whatever each depositor intended, the position works as a lockup, not a loan, and that one row is the argument of this paper.
Across the five protocols in this study, Aave, Aave V4, Spark, Compound and Morpho, we track 524 money-market vaults holding $40.53B. We can measure utilization, the share of a vault's supply that is actually lent, on 424 of them, holding $14.08B. Of that measured supply, $7.63B was out on loan, about 54 cents of every dollar. $4.73B, a third of measured supply, sat in 61 vaults lending less than 15% of their balance.
Read naively, that is $4.73B of vanity TVL. Most of it is something more ordinary. $4.35B of the idle pile is non-stablecoin supply, mostly liquid-staking ether and bitcoin tokens, the assets lending markets mainly use as collateral. Stablecoins tell the opposite story. In vaults of $1M or more, 79.0% of measured stablecoin supply was on loan, against 23.7% of everything else. And the subsidy story barely shows up. Weighted by vault size, reward tokens made up 3.7% of the headline yield across all 524 vaults, and exactly one vault was both idle and paid mostly in rewards, a $5.2M tGBP vault on Morpho.
Where the idle money sits
Sort the measured vaults by how much supply sits idle and the top of the list is collateral assets. Six of the ten largest lockups are bitcoin tokens, one is staked ether, and the other three are dollar-linked tokens, two of them built on Ethena's sUSDe.
| Rank | Protocol | Chain | Asset | TVL | Utilization | Active loans |
|---|---|---|---|---|---|---|
| 1 | Spark | Ethereum | wstETH | $2.20B | 0.0% | $8K |
| 2 | Aave | Plasma | sUSDe | $264.9M | 0.0% | $0 |
| 3 | Aave | Plasma | syrupUSDT | $246.2M | 0.0% | $0 |
| 4 | Spark | Ethereum | LBTC | $213.2M | 0.0% | $0 |
| 5 | Aave | Arbitrum | WBTC | $184.4M | 10.6% | $19.5M |
| 6 | Spark | Ethereum | WBTC | $155.6M | 0.2% | $268K |
| 7 | Aave | Base | cbBTC | $151.4M | 4.5% | $6.7M |
| 8 | Aave | Avalanche | BTC.b | $129.7M | 3.2% | $4.1M |
| 9 | Spark | Ethereum | cbBTC | $122.3M | 2.5% | $3.0M |
| 10 | Aave | Plasma | PT-sUSDE-22OCT2026 | $108.3M | 0.0% | $0 |
/v1/vaults · as of 2026-07-12 · vanity_offenders.csvWe cannot see why each depositor supplied these assets. We can see that they earn next to nothing as loans and that lending markets mainly use them as collateral. On Compound III, collateral earns no interest at all.2 These positions add to a TVL ranking without establishing lending demand.
DeFi lending runs on collateral because its borrowers are anonymous, and the BIS has described overcollateralisation as pervasive for that reason.3 A ranking by deposits therefore rewards a market for holding collateral assets, and the biggest of those markets top the table without lending much at all.
Stablecoins carry the lending
The split by asset is the sharpest result in the run. In vaults of $1M or more, 79.0% of the $7.75B of stablecoin supply we measure was on loan. For the $6.28B of everything else the figure was 23.7%. In this data, stablecoins are what gets borrowed, and the rest mostly sits unborrowed.
Idle stablecoin supply, the thing a TVL skeptic expects to find, came to $377.7M, 4.9% of measured stablecoin supply. Even that overstates idle lending cash. The stablecoin label in our data is an asset flag, not a statement of intent, and it sweeps in yield-bearing tokens such as sUSDe, which Ethena mints when holders stake USDe,4 and sUSDS, a savings token.5 Supplied to a money market, those mostly sit unborrowed as well. The largest idle stablecoin position is $264.9M of sUSDe on Aave's Plasma market with no borrowing at all.
| Asset | Protocol | Chain | TVL | Utilization |
|---|---|---|---|---|
| sUSDe | Aave | Plasma | $264.9M | 0.0% |
| PYUSD | Spark | Ethereum | $100.0M | 6.9% |
| sUSDe | Aave | Monad | $4.0M | 0.0% |
| sUSDe | Aave V4 | Ethereum | $3.7M | 0.0% |
| sUSDS | Spark | Ethereum | $3.3M | 0.0% |
| EURS | Aave | Polygon | $1.9M | 13.6% |
/v1/vaults · as of 2026-07-12 · summary.json, headline.idleStableConstituentsThe one large position that looks like unlent cash is $100.0M of PYUSD on Spark at 6.9% utilization. It is a real idle stablecoin balance, and it is the exception.
Where the yield comes from
Reward tokens are the usual suspect when a yield looks too good, so we split every headline yield into the base rate and the rewards on top. For a lending market the base rate is the interest borrowers pay. For a savings vault it is the savings rate the issuer sets.5 Weighted by vault size, rewards made up 3.7% of headline yield across all 524 vaults.
The twenty largest vaults by TVL hold $29.35B. Nineteen of them pay their headline yield entirely as base rate. The twentieth, Compound's USDC market on Ethereum, adds 0.10 percentage points of rewards to a 3.33% headline. Six of the twenty pay suppliers less than 0.01%, and all six are staked ether or bitcoin tokens.
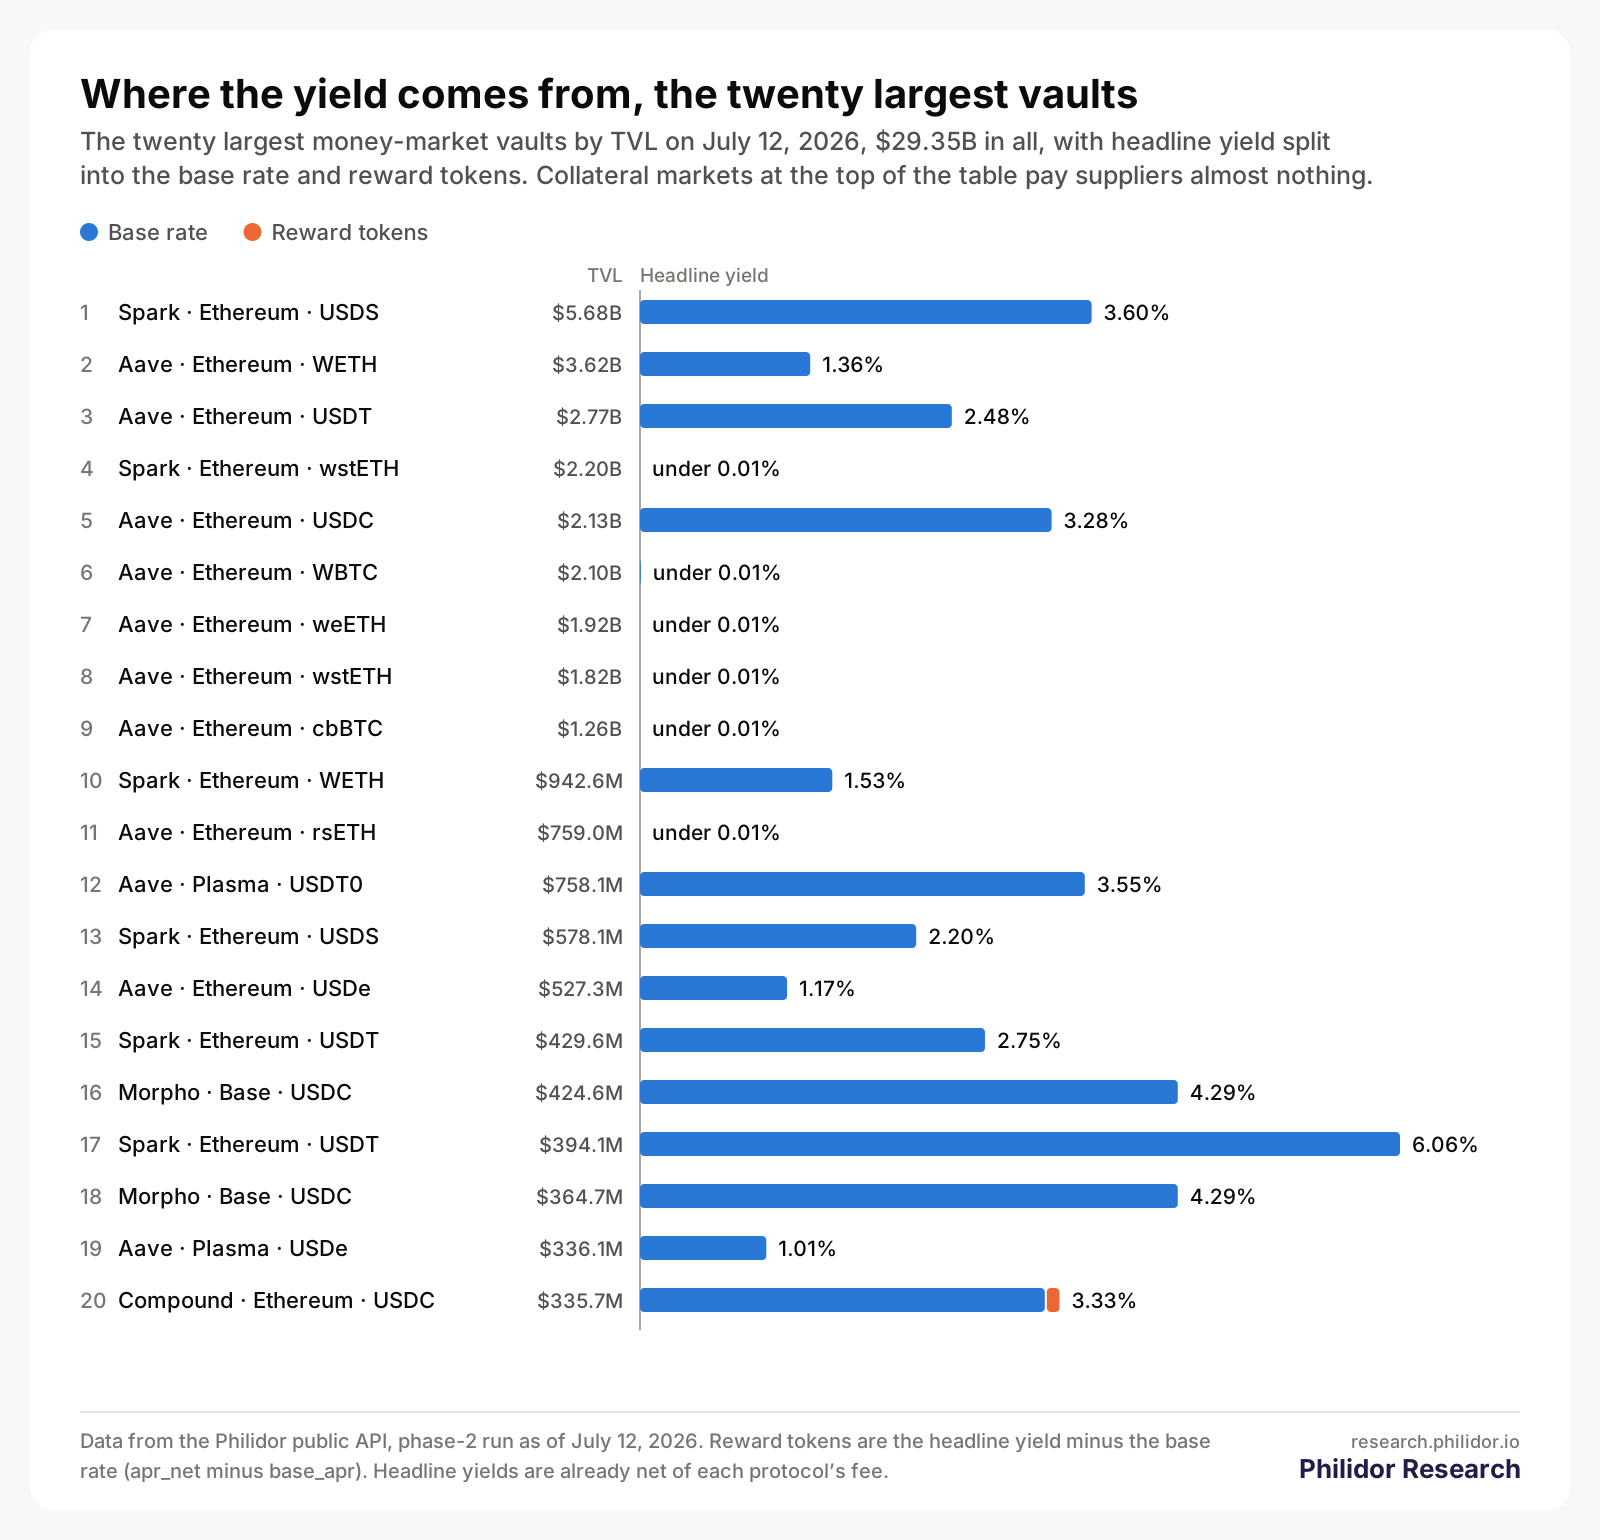
Our data flags a vault as reward-dependent when rewards make up more than half of a headline yield of at least 1%, in vaults of $1M or more. The flag fires on six vaults holding $648.4M, 1.6% of the 366 vaults with a computed real-yield share, and all six are on Morpho. Two curated vaults on Ethereum carry most of it, $594.6M between them. A PYUSD vault holding $327.9M takes 39.1% of its yield from the base rate, and an RLUSD vault holding $266.7M takes 40.3%. Neither is idle. They lend 84.7% and 82.5% of their supply, so the rewards sit on top of real borrowing rather than in place of it.
The search for idle capital paid in emissions, the pattern a TVL skeptic would expect, turns up one vault. A tGBP vault on Morpho holding $5.2M is both idle and reward-dependent. That is the whole list.
Both tails are risk
Utilization is honest in both directions. A market that lends almost nothing earns less than its deposits imply. A market that lends almost everything has little unborrowed balance left for depositors who want out. Gudgeon, Werner, Perez and Knottenbelt made the point about Compound, Aave and dYdX in 2020. High utilization pays suppliers well and leaves them exposed to being unable to redeem.6
16 vaults holding $434.7M report more than 95% of their supply on loan, 3.8% of the vaults we measure. One Spark USDT market on Ethereum holds $394.1M of that at 96.0%. Four of the sixteen are Morpho vaults whose reported utilization runs above 110%, a data-quality artifact in the vault totals that we flag in the data.
The protocols sit at opposite ends. The typical Morpho vault lends 88.7% of its supply and the typical Compound market 73.2%. The typical Aave market we measure lends 7.0%, Spark 1.3% and Aave V4 0.3%.
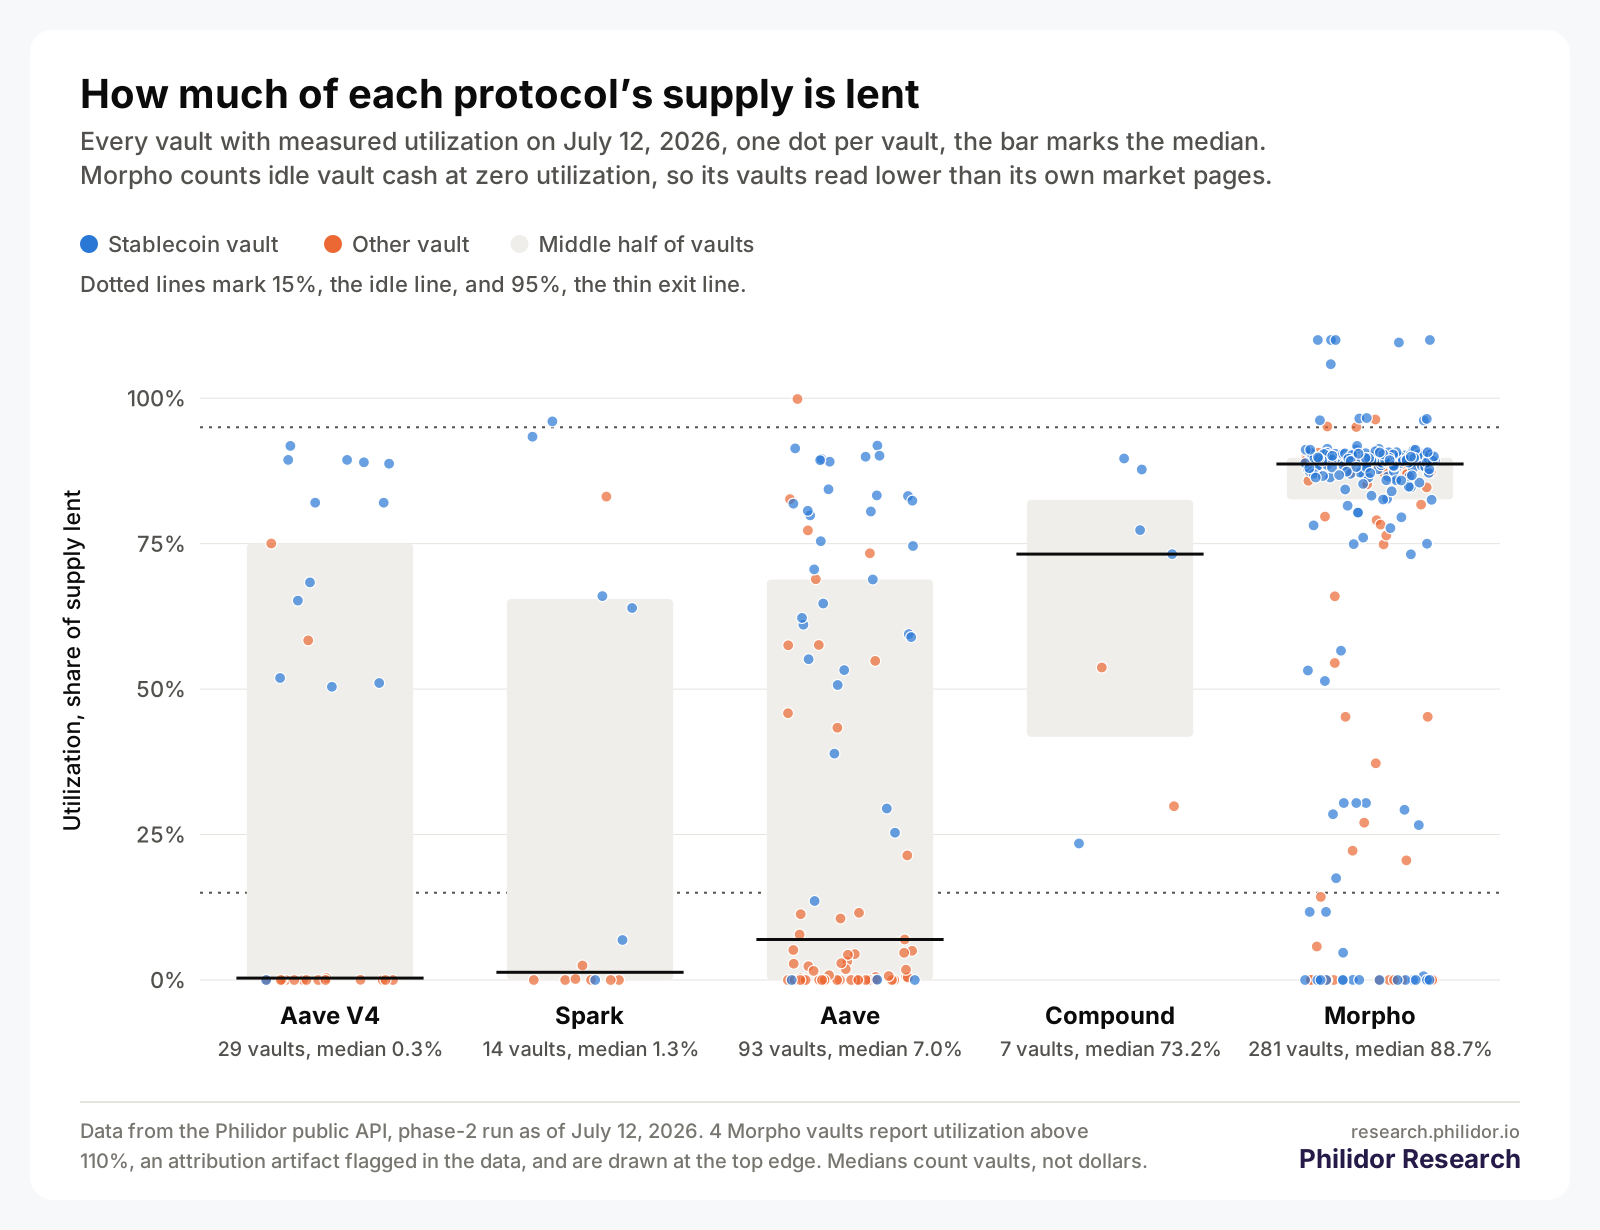
The split is structural. A Morpho vault is curated, and its curator allocates deposits to markets that have borrowers. Aave and Spark list many assets that lending markets mainly use as collateral, each listing is its own vault in our data, and those markets pull the medians down. Galaxy Research describes wrapped bitcoin the same way, used mainly as collateral and rarely at high utilization.1
One convention lowers the Morpho numbers on purpose. We count cash a Morpho vault holds outside any market at zero utilization, so our figures read lower than Morpho's own market pages. Idle cash is the signal this paper is about, so it stays in the denominator. Medians in this section count vaults, not dollars.
Fee take, in each protocol's own terms
Fee take is the last real metric and the easiest to misuse, because each protocol takes its cut on a different base. A reserve factor is a share of the interest borrowers pay, set aside by the protocol.6 A Morpho performance fee is a share of the yield the vault earns, set by the vault's curator or owner.7 Compound III works on a different base again. Our data records no fee parameter for it, and it sets the supply rate and the borrow rate with separate models,2 so we read its take from the gap between the supply and borrow rates. We report which kind of fee each vault declares and never combine them into one rate. Every headline yield in this paper is already net of these fees.
| Protocol | Fee type declared | Vaults | TVL | What the fee is |
|---|---|---|---|---|
| Aave | Reserve factor | 93 | $4.05B | A share of borrower interest kept by the protocol |
| Aave | None reported | 63 | $19.05B | A gap in our data, 58 of them the Ethereum reserves |
| Aave V4 | Liquidity fee | 29 | $274.8M | Aave V4 protocol fee on borrower interest |
| Spark | Reserve factor | 14 | $5.11B | A share of borrower interest kept by the protocol |
| Spark | None reported | 9 | $7.35B | Savings vaults, which have no borrow market |
| Compound | None, by design | 8 | $574.3M | No fee parameter in our data, see the implied spread below |
| Morpho | Performance fee | 308 | $4.12B | A share of vault yield set by the vault's curator or owner |
For Compound we compute an implied spread, one minus the supply rate divided by the product of the borrow rate and utilization. It is the share of borrower interest that does not reach suppliers. The USDC market on Ethereum shows 9.8%, USDS on Ethereum 8.6% and USDT on Ethereum 1.3%. On the four markets on Arbitrum and Base that report a borrow rate, the formula comes out below zero, meaning suppliers were quoted more than borrowers paid on the lent share at the reading. The run floors these at zero, and we read them as neither a take nor a subsidy. The table shows each value before the floor.
| Market | TVL | Utilization | Supply rate | Borrow rate | Implied spread |
|---|---|---|---|---|---|
| Ethereum USDC | $335.7M | 89.6% | 3.23% | 3.99% | 9.8% |
| Ethereum USDT | $192.0M | 77.3% | 2.78% | 3.65% | 1.3% |
| Arbitrum USD₮0 | $19.7M | 53.7% | 1.93% | 2.99% | 0.0%, floored from −20.3% |
| Arbitrum USDC | $15.8M | 73.2% | 2.64% | 3.53% | 0.0%, floored from −1.9% |
| Base USDC | $8.3M | not measured | 7.88% | not reported | not computable |
| Ethereum USDS | $1.9M | 87.7% | 3.16% | 3.94% | 8.6% |
| Base USDS | $459K | 23.5% | 1.27% | 2.67% | 0.0%, floored from −102.0% |
| Base AERO | $360K | 29.9% | 1.19% | 3.18% | 0.0%, floored from −25.7% |
/v1/vaults · as of 2026-07-12 · vaults.csv, impliedSpreadBackground and prior work
Total value locked became DeFi's headline number because it is easy to compute and easy to compare. Its weaknesses are documented. Luo, Feng, Xu and Tasca showed in 2024 that it double counts wrapped and leveraged positions, and proposed a redeemable-value measure in its place.8 The BIS wrote in 2022 that DeFi lending mostly finances crypto speculation and relies on collateral because its borrowers are anonymous.3 On the mechanics, Gudgeon and coauthors set out in 2020 how lending protocols price funds from utilization and take a reserve factor from borrower interest, and documented stretches when nearly all supplied funds were lent out.6
The closest desk treatment is Galaxy Research, which sizes crypto lending by open borrows rather than deposits. Its April 2025 report put onchain utilization at 41.45% across the chains it covers as of March 31, 2025, and described wrapped bitcoin and liquid-staking ether as mainly collateral.1 That is the aggregate view.
Prior work established that TVL overstates economic activity and that DeFi lending is built on collateral. This paper adds the vault-level view from our own production data. It separates collateral assets from unlent stablecoin supply, splits the headline yield into base rate and rewards, and reports each protocol's fee in its own terms, with the outside reference attached as a labeled column.
How we measured it
Every measurement of our own in this paper comes from the retained run against our public API, as of July 12, 2026, with no database access. The DefiLlama column and the outside figures in the background section are labeled as such. The saved /v1/vaults listing contains 875 vaults, of which 524 belong to the five money-market protocols in this study. The original page envelopes and their server totals were not retained, so the saved listing cannot independently prove the completeness of that pagination.
The listing and the saved /v1/stats response use different populations. The stats response covers 866 vaults. The difference is nine markets marked shut down, all in the money-market sample, holding $845.1M. This paper retains them in its 524 rows. Seven report utilization, with $85.9M supplied and $125K lent. Excluding the shut-down rows reproduces the saved stats counts, TVL, loan total and weighted utilization within floating-point precision. Agreement between the unadjusted rollups within one percentage point does not establish that they cover the same population. The population audit records the source hashes, identities and reconciliation.
Utilization, borrow rate, fee type and both yields come straight from each vault record. Active loans are utilization times TVL. The real-yield share is the base rate divided by the headline yield, clamped between zero and one, and left blank when the headline yield is near zero. A vault counts as idle below 15% utilization with at least $1M of TVL, and as thin exit liquidity above 95%. The reward-dependent flag needs a real-yield share below one half, a headline yield of at least 1% and $1M of TVL.
DefiLlama is kept only as a labeled cross-check on the reserve markets, Aave, Spark and Compound.9 We match on protocol, chain and asset, and drop any key that resolves to more than one DefiLlama market rather than guess. That attaches a DefiLlama value to 123 of our 524 vaults, 23.5%. Each of our keys maps to at most one DefiLlama market, but one market can serve several of our vaults. Five Spark savings vaults carry the value of the Spark reserve with the same asset, so we judge agreement only on the 75 rows where both sides report utilization, each a different DefiLlama reserve. The median gap there is under 0.0001, 55 of the 75 rows are that close, and 74 agree within one percentage point. The exception is Aave's WETH market on Arbitrum, $140.4M, at 77.3% in our data and 55.7% in DefiLlama's, a gap of 21.6 points that the run does not explain. Morpho and Aave V4 stay out of the comparison because a vault there does not map to a single DefiLlama market.
Four Morpho vaults report utilization above 110%. That is a data-quality artifact, an unreliable vault total under the ratio, not a measure of lending. We flag these rows and leave them in. They do not change the displayed protocol medians.
Limits
One day. This is a single reading as of July 12, 2026. Utilization and rates move every block, and a later reading moves every number here.
Coverage. We measure utilization on 424 of 524 vaults, 80.9% by count but 34.7% by TVL. Most of the gap sits with Aave and Spark on Ethereum. All 58 Aave reserves on Ethereum, $18.99B, carried no utilization in our data at the reading, and 6 of Spark's 20 Ethereum vaults, $7.06B, are savings vaults where utilization does not apply. In all, 100 vaults holding $26.45B are unmeasured. We never fill a missing utilization with zero, because zero is a claim.
The denominator. Every share in this paper is a share of what we track, the 524 money-market vaults on the chains we cover, or of the $14.08B within them we can measure. None is a share of all DeFi lending. The run reports no market-wide DefiLlama total, so DefiLlama enters only as the labeled per-vault column. Where our own data is blank that column stays labeled as DefiLlama's, and a value there can be shared by several of our vaults, so we do not fold it into our totals.
Fees do not compare across protocols. A reserve factor, a liquidity fee and a performance fee sit on different bases. Figure 4 reports which one each vault declares and does not rank them.
The Morpho convention. Idle vault cash counts at zero utilization, so Morpho reads lower here than in its own interface.
What would change the reading. The unmeasured Aave Ethereum reserves are the test. If they are lent like our measured stablecoin supply, the idle share of everything we track is smaller than the measured third. If they look like the measured collateral markets, it is larger. The split between collateral assets and unlent cash is the number to recheck when they are measured.
What an allocator does with this
Read a money market by its active loans, not its deposits. A deposit figure counts everything supplied, collateral assets and loanable cash alike. Active loans say how much of it is lent. Utilization says how much of the balance was unborrowed at the reading, which is a point-in-time estimate rather than a guaranteed exit.
Check both tails. Below 15% the headline yield is earned on a small lent base. Above 95% there is little unborrowed balance, and a depositor who wants out relies on borrowers repaying or new supply arriving.
Split the yield before trusting it. Across the vaults we track the base rate carries almost all of it, so a vault whose yield leans on rewards stands out, and the question to ask is what it pays when the rewards stop.
For a microvault operator sizing real borrow demand, the number to size against is active loans in the target market. Wherever collateral assets dominate, that is a fraction of TVL.
Data and sources
The run's own files are committed with this paper. summary.json holds every headline figure. vaults.csv holds one row per vault. league_table_top50.csv and vanity_offenders.csv hold the league tables. board_loans_not_lockups.json lists every number in this paper with the file and field it comes from, and provenance.json records the hash of each file. Every figure is drawn from these files.
- Utilization:
borrowed ÷ supplied, read from each vault record - Active loans:
utilization × tvl_usd - Real-yield share:
base_apr ÷ apr_net, clamped to the range 0 to 1, blank when apr_net ≤ 0.0001 - Idle:
utilization < 0.15 and tvl_usd ≥ 1,000,000 - Thin exit liquidity:
utilization > 0.95 - Compound implied spread:
1 − base_apr ÷ (borrow_apr × utilization), floored at 0
References
-
Pokorny, Z. (2025). The State of Crypto Lending. Galaxy Research, 14 April 2025. Accessed 2026-10-16. ↩ ↩2 ↩3
-
Compound Labs (2026). Interest Rates. Compound III Docs. Accessed 2026-10-16. ↩ ↩2
-
Aramonte, S., Doerr, S., Huang, W. & Schrimpf, A. (2022). DeFi lending: intermediation without information? BIS Bulletin No 57. ↩ ↩2
-
Ethena Labs (2026). Staking USDe. Ethena Docs. Accessed 2026-10-16. ↩
-
Spark (2026). Spark Savings. Spark Docs. Accessed 2026-10-16. ↩ ↩2
-
Gudgeon, L., Werner, S. M., Perez, D. & Knottenbelt, W. J. (2020). DeFi Protocols for Loanable Funds: Interest Rates, Liquidity and Market Efficiency. arXiv:2006.13922. ↩ ↩2 ↩3
-
Luo, Y., Feng, Y., Xu, J. & Tasca, P. (2024). Piercing the Veil of TVL: DeFi Reappraised. arXiv:2404.11745. ↩
-
DefiLlama (2026). Yields lendBorrow endpoint. Snapshot pulled with the run of 2026-07-12. Endpoint re-checked 2026-10-16. ↩